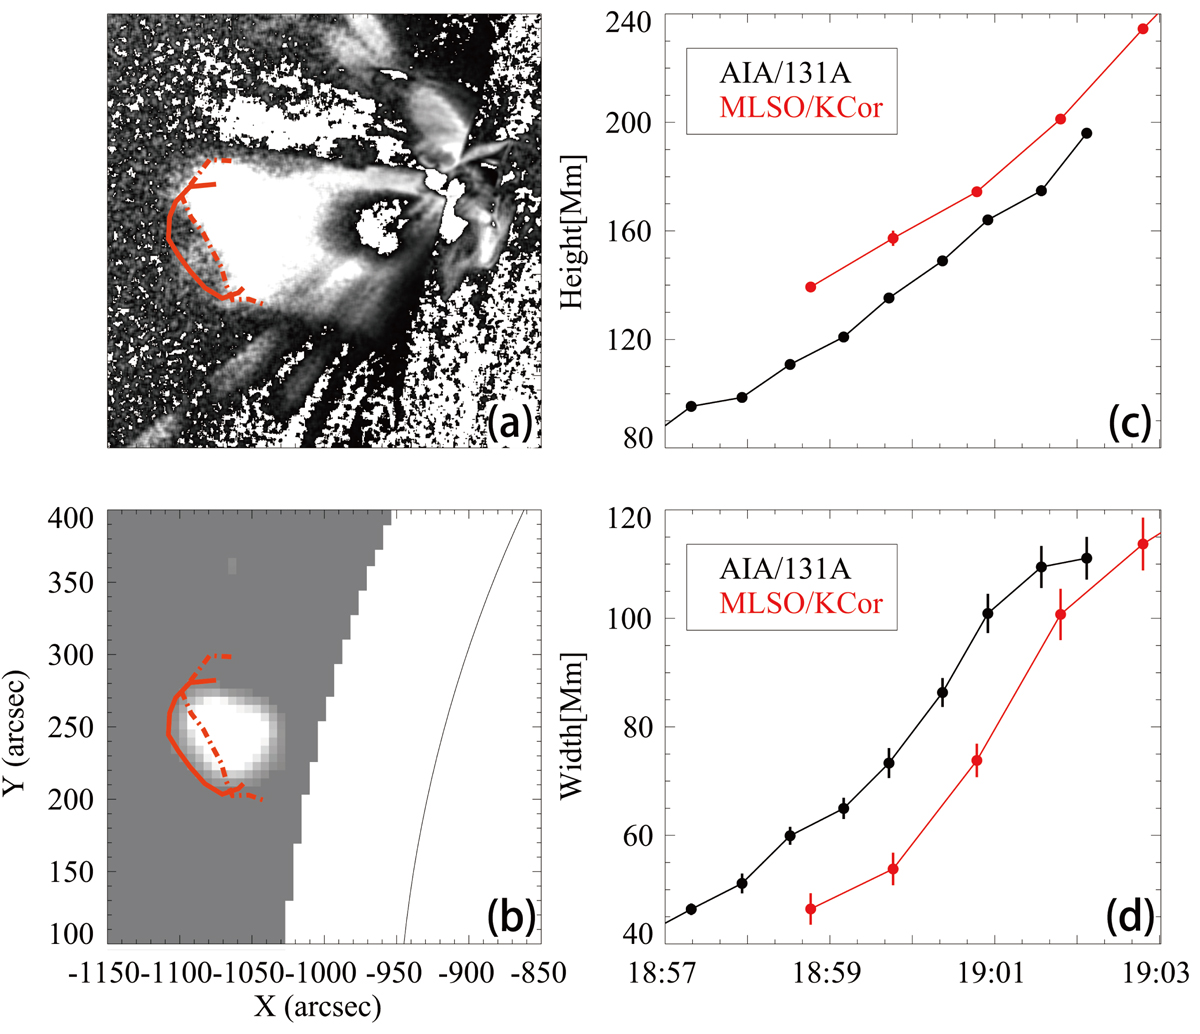
Fig. 4.
Download original image
Morphological comparison between the EUV blob and the white-light bright core. (a) AIA 131 Å base-difference image (at 18:59:43 UT) showing the EUV blob. The dashed red line delineates the top boundary of the EUV blob, and the solid red line represents that of the white-light bright core. (b) K-Cor base-difference image (at 18:59:46 UT) showing the white-light bright core. The FOV of panel a is the same as that of panel b. (c) Height-time profile of the CME EUV core and white-light core. Panel d: is similar to panel c, but shows the width-time profile.
Current usage metrics show cumulative count of Article Views (full-text article views including HTML views, PDF and ePub downloads, according to the available data) and Abstracts Views on Vision4Press platform.
Data correspond to usage on the plateform after 2015. The current usage metrics is available 48-96 hours after online publication and is updated daily on week days.
Initial download of the metrics may take a while.