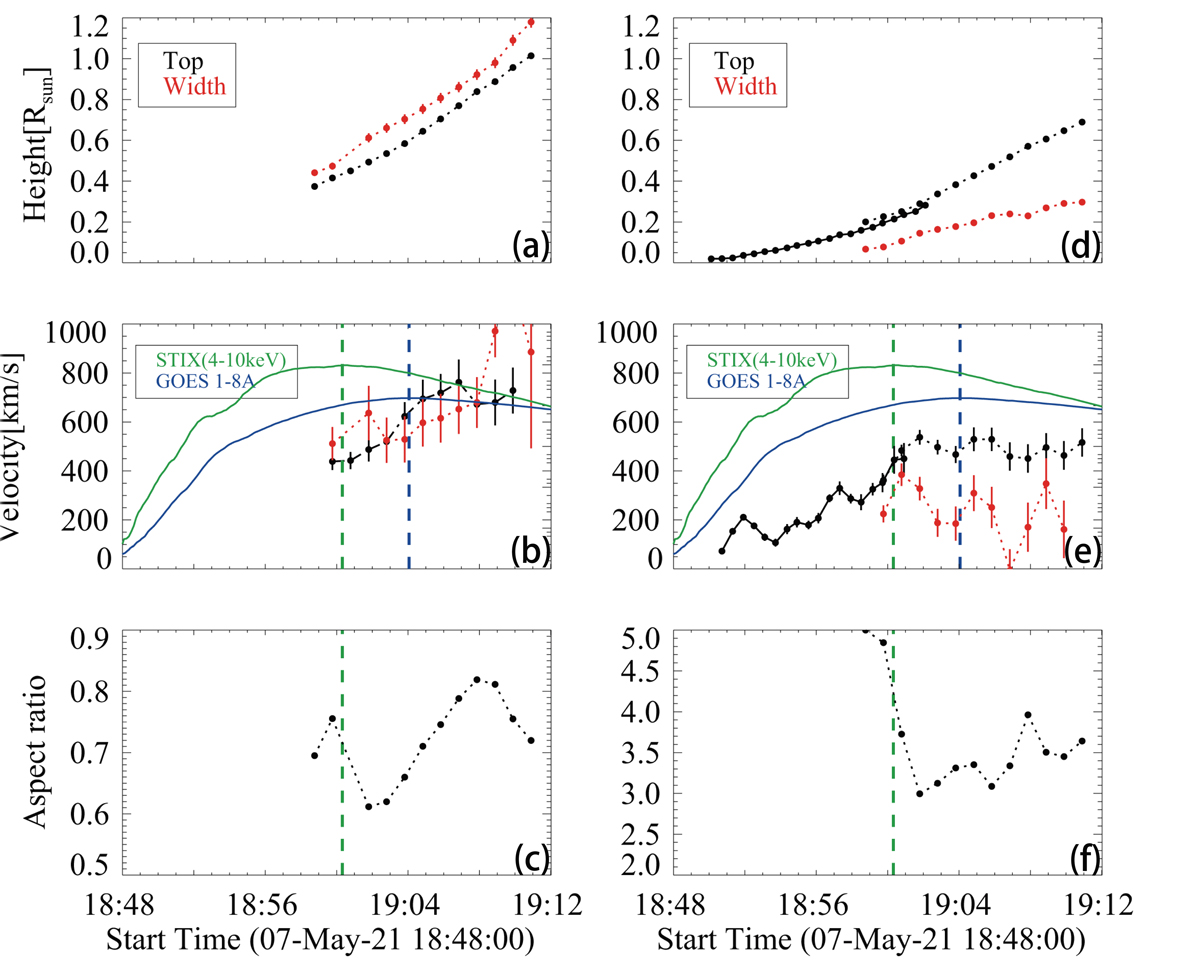
Fig. 3.
Download original image
Early temporal evolution of the CME bubble and bright core in the radial and lateral directions. (a) Temporal evolution of the height and width of the CME bubble. (b) Temporal evolution of the radial and expansion velocities. The vertical bars denote their uncertainties. The STIX 4–10 keV and GOES 1–8 Å fluxes are also plotted in green and blue, respectively. The two vertical dashed lines mark their peaks. (c) The aspect ratio of the CME bubble. Panels d–f: are similar to Panels a–c, but show the CME bright core. The black dots connected by solid and dashed lines are the measurements from the EUV blob and white-light bright core, respectively.
Current usage metrics show cumulative count of Article Views (full-text article views including HTML views, PDF and ePub downloads, according to the available data) and Abstracts Views on Vision4Press platform.
Data correspond to usage on the plateform after 2015. The current usage metrics is available 48-96 hours after online publication and is updated daily on week days.
Initial download of the metrics may take a while.