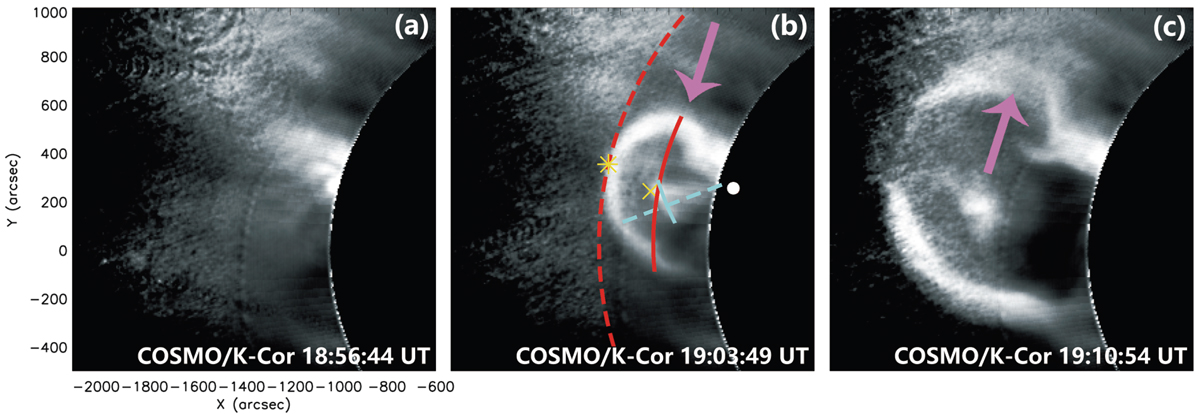
Fig. 2.
Download original image
K-Cor images of 2021 May 07 CME. The dashed cyan line shows the eruption direction of the bright core. The white point and yellow cross in panel b have the same meaning as in Fig. 1b. The solid cyan line indicates the width of the bright core. The dashed red line represents part of a circle with a center at the solar center, which is tangent to the CME leading front, while the yellow asterisk marks its position. The solid red line shows the width of the CME bubble. Purple arrows mark the positions of the interaction between the CME front and streamer. (An animation of this figure is available online.)
Current usage metrics show cumulative count of Article Views (full-text article views including HTML views, PDF and ePub downloads, according to the available data) and Abstracts Views on Vision4Press platform.
Data correspond to usage on the plateform after 2015. The current usage metrics is available 48-96 hours after online publication and is updated daily on week days.
Initial download of the metrics may take a while.