Fig. 5
Download original image
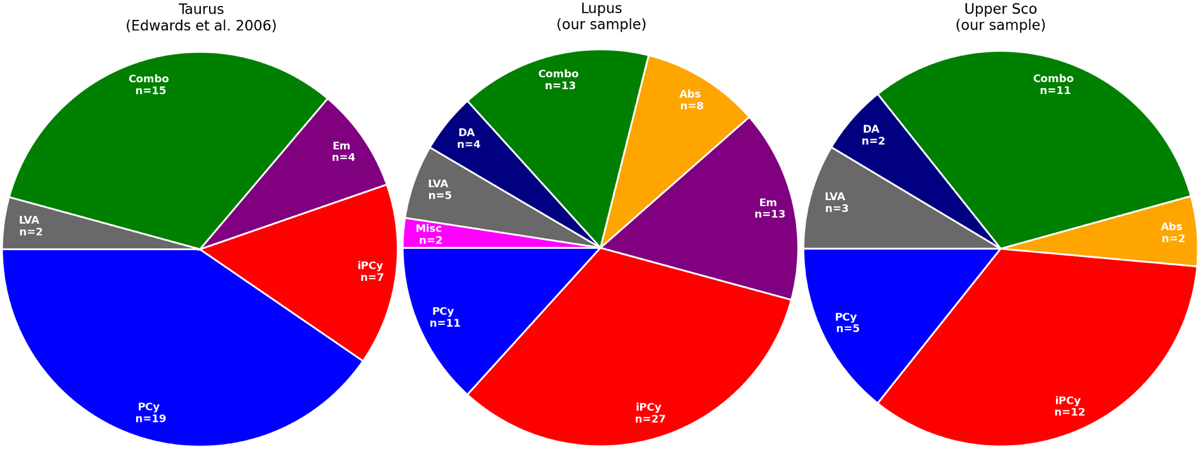
Pie charts showing the proportions of each profile type identified in our sample of 82 sources in Lupus and 35 sources in Upper Scorpius, middle and right respectively. We compare the proportion of profile types observed in our sample to those of a sample of 38 targets located in the Taurus star forming region from Edwards et al. (2006). The colours of the wedges in each pie chart represent each profile type – blue P Cygni profiles; red inverse P Cygni profiles; purple pure emission profiles; orange absorption-only profiles; green combination profiles; navy blue double absorption profiles; grey low velocity absorption profiles and pink miscellaneous profiles.
Current usage metrics show cumulative count of Article Views (full-text article views including HTML views, PDF and ePub downloads, according to the available data) and Abstracts Views on Vision4Press platform.
Data correspond to usage on the plateform after 2015. The current usage metrics is available 48-96 hours after online publication and is updated daily on week days.
Initial download of the metrics may take a while.