Fig. 3
Download original image
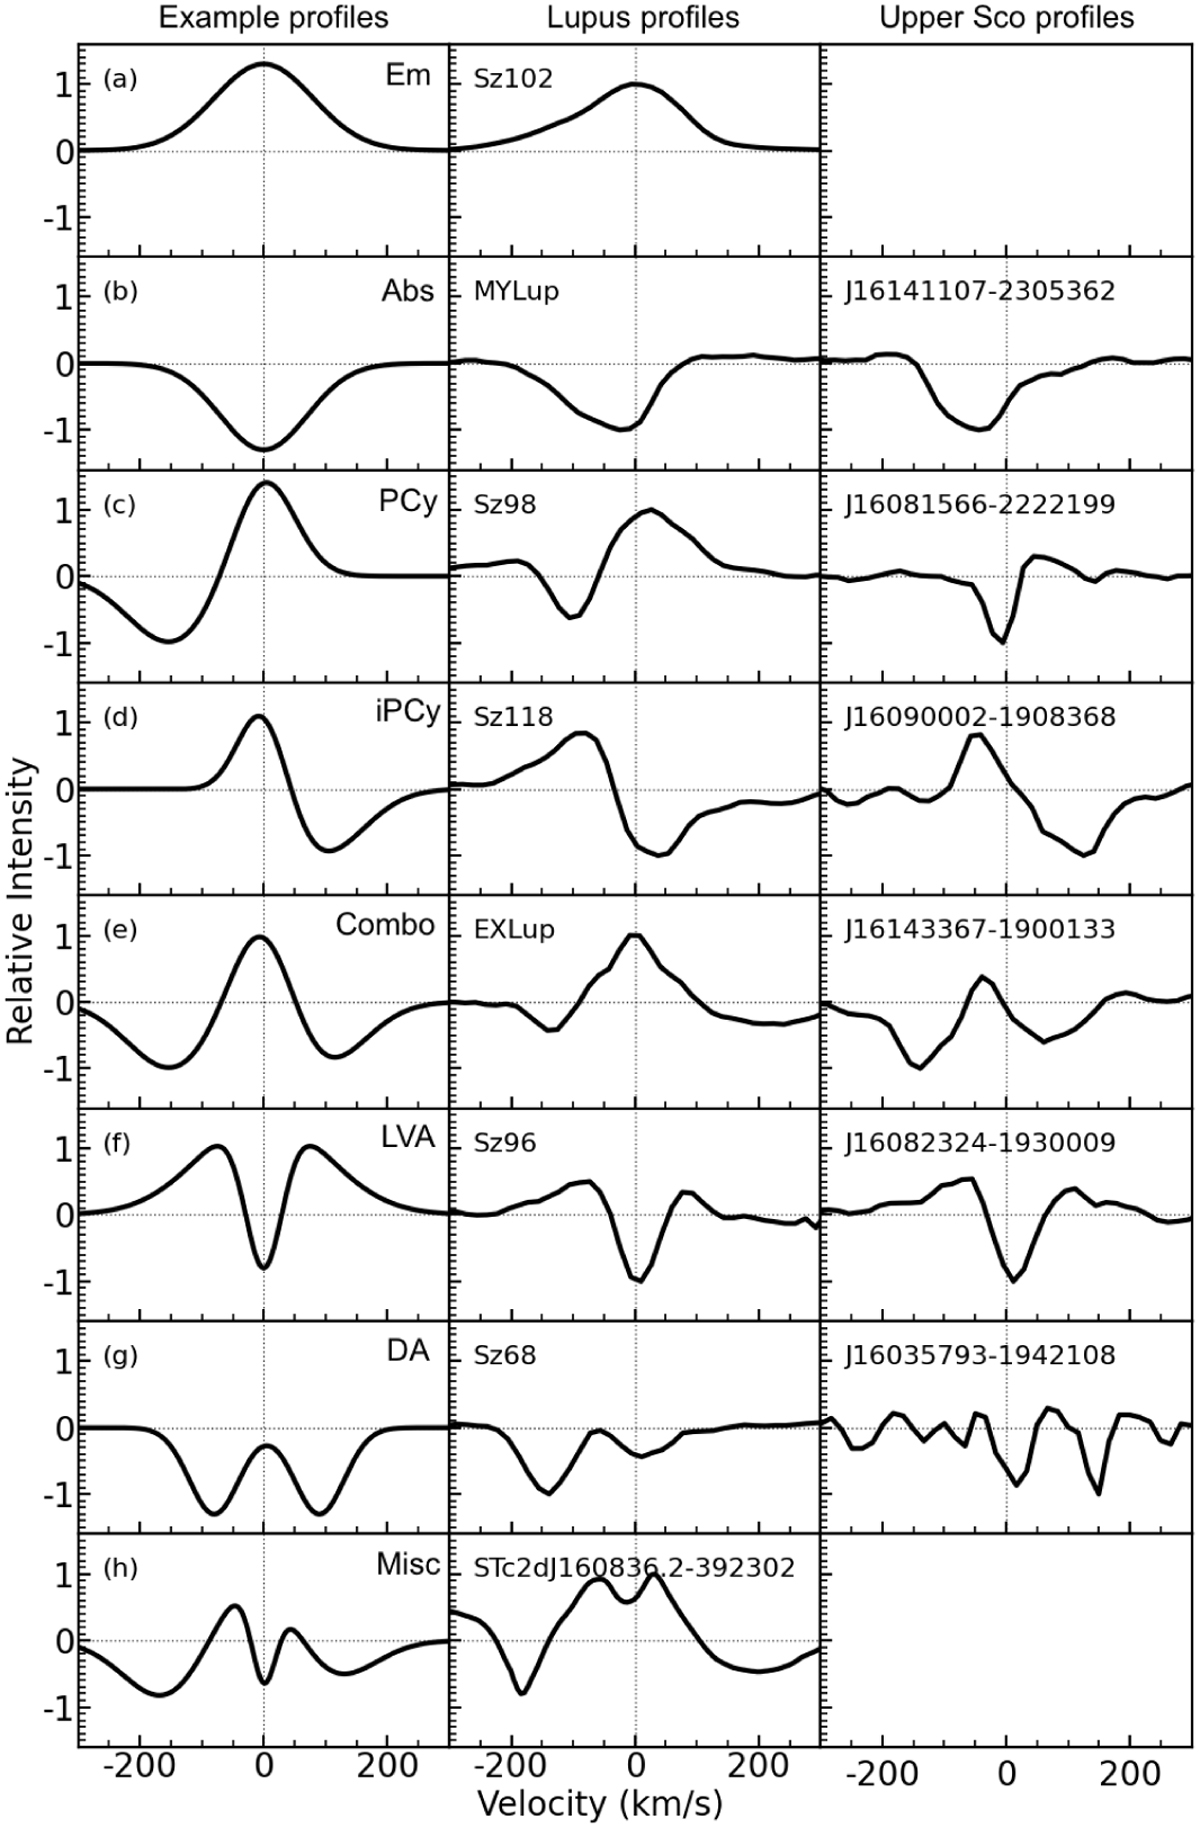
Theoretical profile types and example He I λ10830 Å profiles observed in our data. Left column: theoretical profiles for the eight profile types described in Sect. 3.2. Middle and right columns: examples of each profile type in the Lupus and Upper Scorpius samples, respectively. The flux has been normalised to the continuum level in each source, and rescaled between ±1 for plotting. The grey horizontal line marks the continuum level at 0, while the vertical grey line denotes 0 km s−1. We observe no pure emission or miscellaneous profile types in the Upper Scorpius sample.
Current usage metrics show cumulative count of Article Views (full-text article views including HTML views, PDF and ePub downloads, according to the available data) and Abstracts Views on Vision4Press platform.
Data correspond to usage on the plateform after 2015. The current usage metrics is available 48-96 hours after online publication and is updated daily on week days.
Initial download of the metrics may take a while.