Fig. 16
Download original image
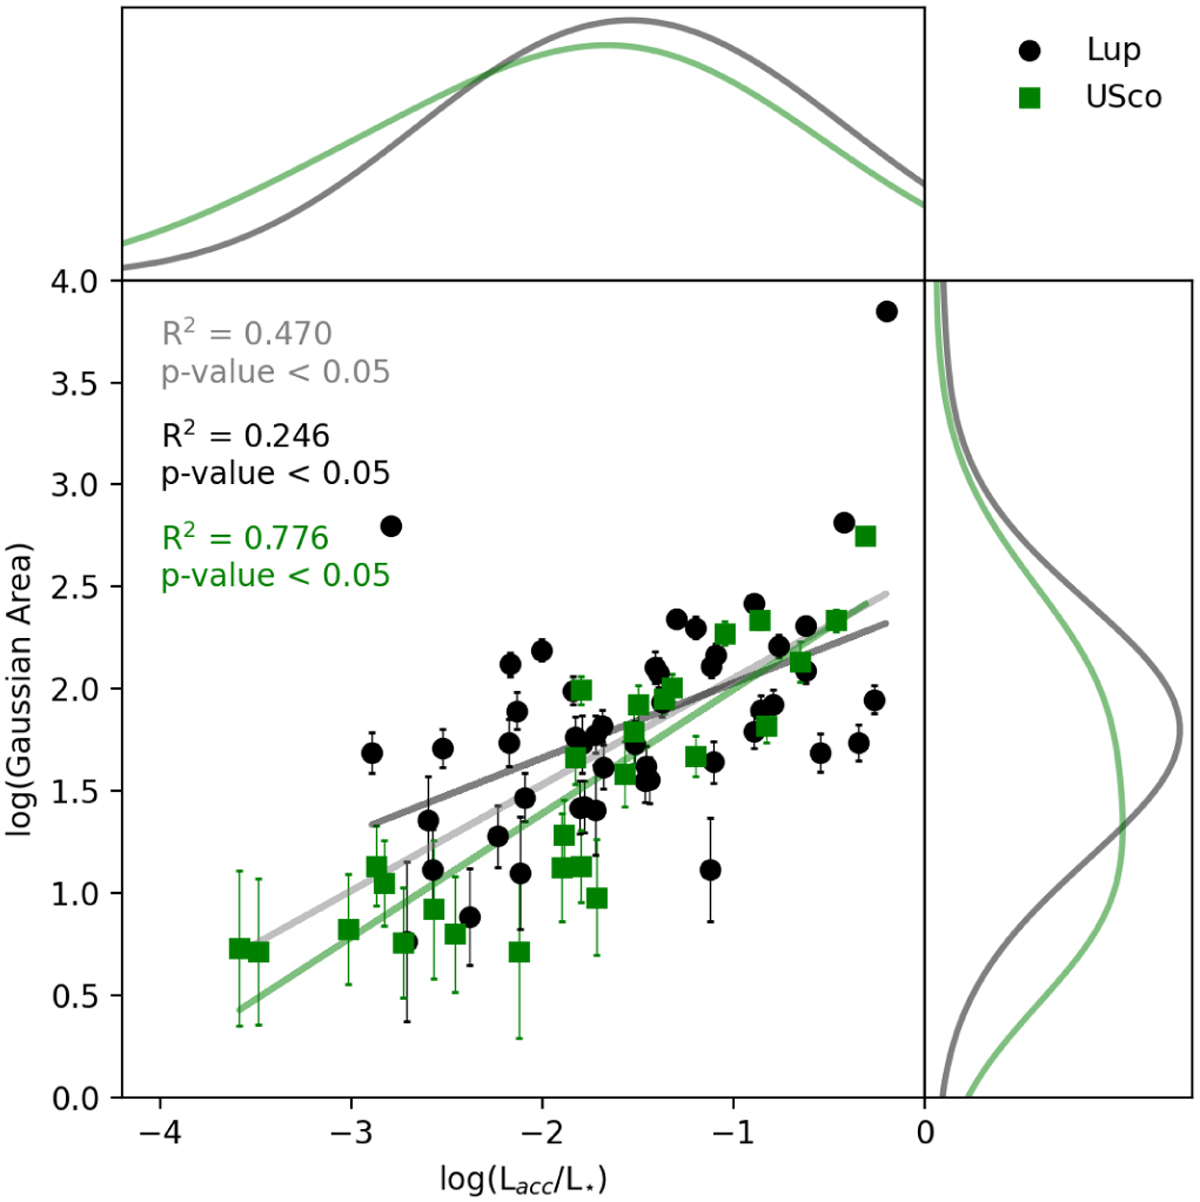
Gaussian area, in units of km s−1 × normalised flux units, versus log(Lacc/L*) of the emission features in pure emission, P Cygni, inverse P Cygni and combination profile types separated by star-forming region. The line of best fit for all datapoints is marked in grey, with a linear fit for Lupus and Upper Sco in black and green, respectively.
Current usage metrics show cumulative count of Article Views (full-text article views including HTML views, PDF and ePub downloads, according to the available data) and Abstracts Views on Vision4Press platform.
Data correspond to usage on the plateform after 2015. The current usage metrics is available 48-96 hours after online publication and is updated daily on week days.
Initial download of the metrics may take a while.