Fig. 15
Download original image
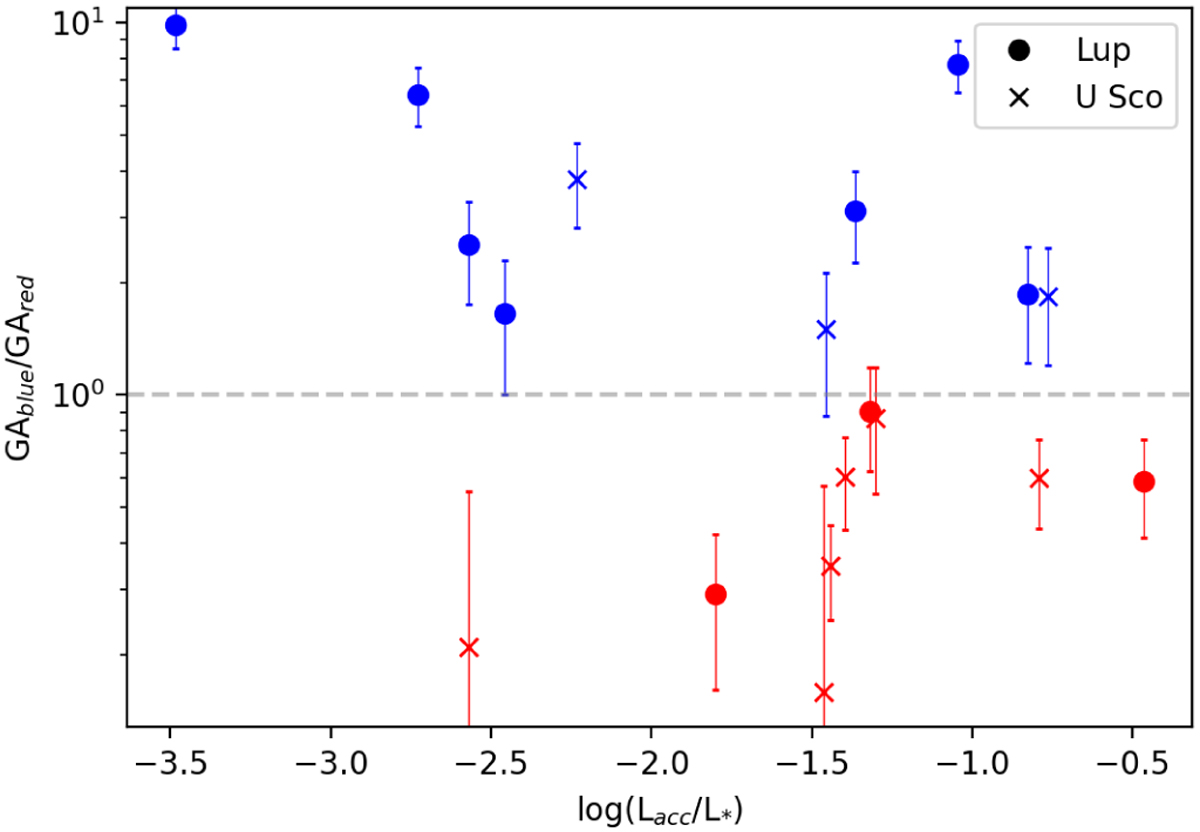
Plot of the Gaussian area, in units of km s−1 × normalised flux units, of the blue-shifted absorption feature divided by that of the red-shifted feature for combination profiles. Combination profiles in Lupus are denoted by circle markers, and those in Upper Sco are marked by an X. The horizontal dashed line (where the ratio is equal to 1) marks where the area of the blue and red features are equal. Blue or red coloured markers indicate blue- or red-dominated sources.
Current usage metrics show cumulative count of Article Views (full-text article views including HTML views, PDF and ePub downloads, according to the available data) and Abstracts Views on Vision4Press platform.
Data correspond to usage on the plateform after 2015. The current usage metrics is available 48-96 hours after online publication and is updated daily on week days.
Initial download of the metrics may take a while.