Fig. 9.
Download original image
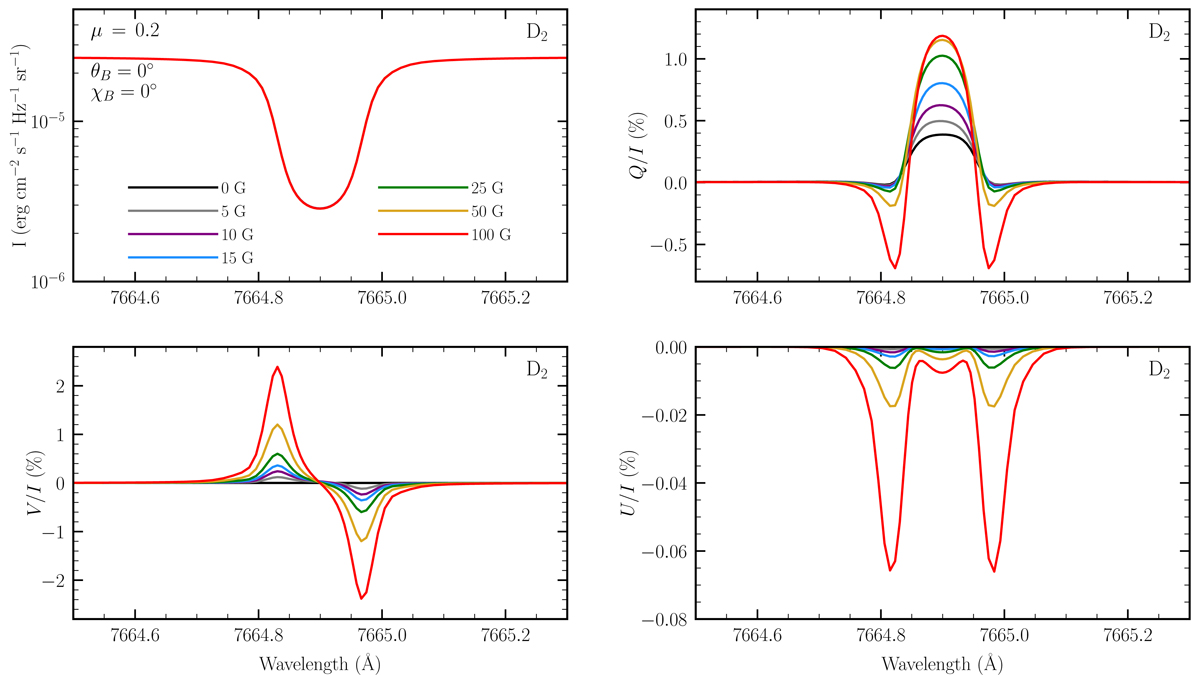
Stokes I (upper left panel), V/I (lower left panel), Q/I (upper right panel), and U/I profile (lower right panel) as a function of wavelength, calculated in the presence of a vertical (θB = 0°) magnetic field. The various colored curves represent different field strengths (see legend). The figures in this subsection only show the spectral range centered on the K I D2 line. For this figure, and the rest of those presented in this work, a two-term atomic model with HFS is considered.
Current usage metrics show cumulative count of Article Views (full-text article views including HTML views, PDF and ePub downloads, according to the available data) and Abstracts Views on Vision4Press platform.
Data correspond to usage on the plateform after 2015. The current usage metrics is available 48-96 hours after online publication and is updated daily on week days.
Initial download of the metrics may take a while.