Fig. 6.
Download original image
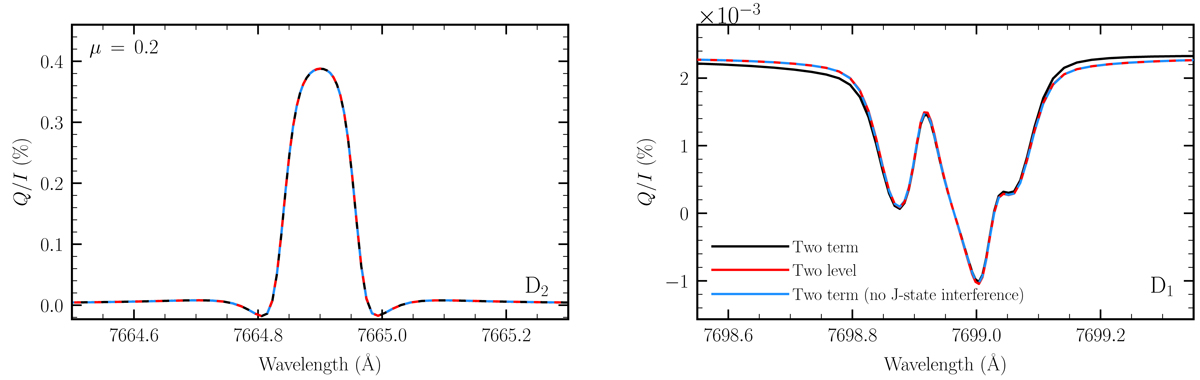
Stokes Q/I profiles as a function of wavelength in the spectral ranges centered on the K I D2 (left panel) and D1 (right panel) lines. The RT calculations were carried out in the absence of a magnetic field. A comparison is shown between the calculations considering a two-term atomic model with HFS, both taking J-state interference into account (black curves) and neglecting it (blue curves), and the calculations considering two-level atomic models with HFS (red curves), in which there is no J-state interference by definition. Overlapping curves are dashed to enhance visibility.
Current usage metrics show cumulative count of Article Views (full-text article views including HTML views, PDF and ePub downloads, according to the available data) and Abstracts Views on Vision4Press platform.
Data correspond to usage on the plateform after 2015. The current usage metrics is available 48-96 hours after online publication and is updated daily on week days.
Initial download of the metrics may take a while.