Fig. 4.
Download original image
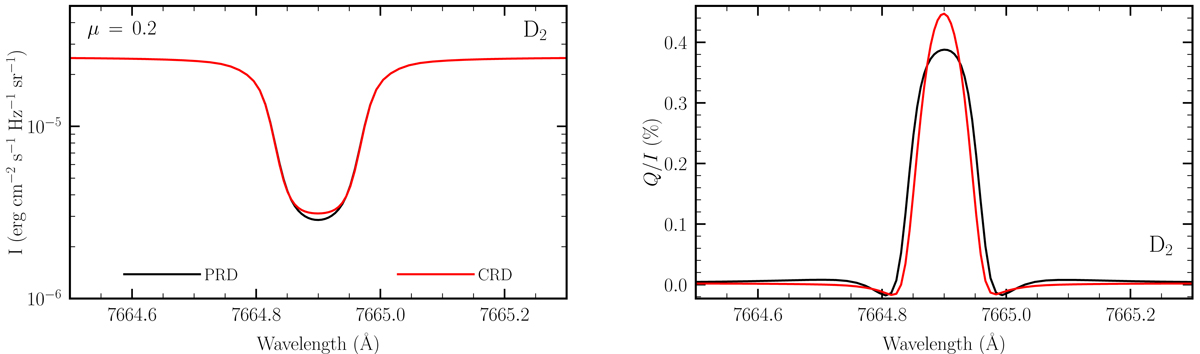
Intensity (left panel) and Stokes Q/I (right panel) profiles as a function of wavelength in the spectral ranges centered on the K I D2 line. The RT calculations were carried out in the absence of a magnetic field and for a two-term atomic model with HFS. The results of the calculation accounting for PRD (black curves) are compared to those obtained in the complete frequency redistribution (CRD) limit (red curves) as described in the text. In this figure and all those shown below, the calculations were carried out considering the FAL-C atmospheric model.
Current usage metrics show cumulative count of Article Views (full-text article views including HTML views, PDF and ePub downloads, according to the available data) and Abstracts Views on Vision4Press platform.
Data correspond to usage on the plateform after 2015. The current usage metrics is available 48-96 hours after online publication and is updated daily on week days.
Initial download of the metrics may take a while.