Fig. D.3.
Download original image
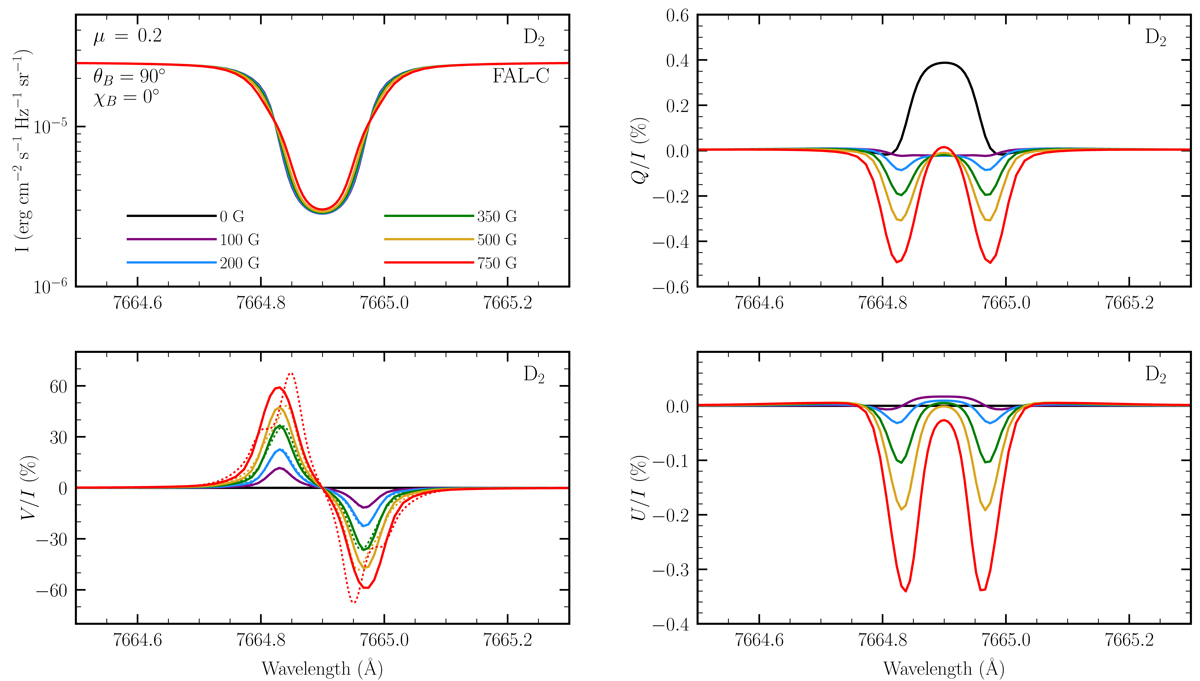
Stokes I (upper left panel), V/I (lower left panel), Q/I (upper right panel), and U/I (lower right panel) profiles as a function of wavelength. The various solid colored curves represent the results of RT calculations (see main text) in the presence of horizontal (θB = 90°) magnetic fields with χB = 0° and strengths up to 750 G (see legend). The considered spectral range is centered on the K I D2 line. The colored dotted curves in the lower left panel represent the V/I profile obtained through the magnetograph formula, for the field strengths shown in the legend.
Current usage metrics show cumulative count of Article Views (full-text article views including HTML views, PDF and ePub downloads, according to the available data) and Abstracts Views on Vision4Press platform.
Data correspond to usage on the plateform after 2015. The current usage metrics is available 48-96 hours after online publication and is updated daily on week days.
Initial download of the metrics may take a while.