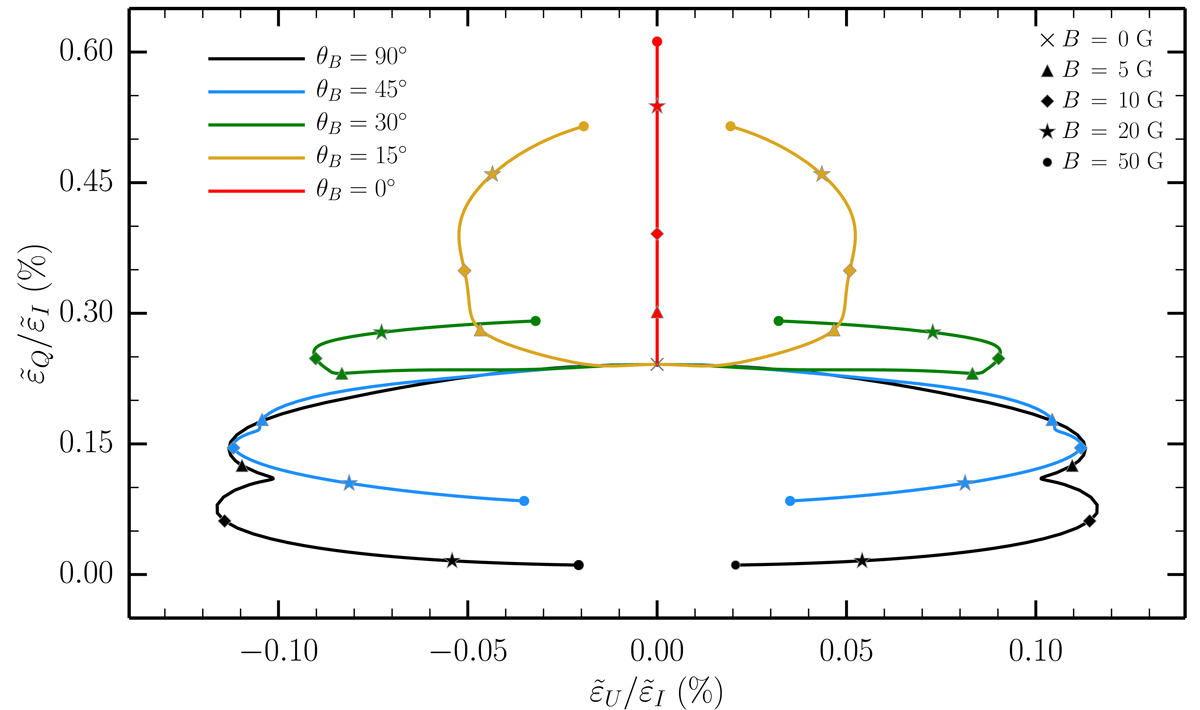
Fig. C.1.
Download original image
Hanle diagram that shows the relation between the Stokes Q and U components of the line scattering emission vector, normalized to the intensity component, according to the strength and orientation of the magnetic field. The emission vector was obtained as described in the text and it was integrated over wavelength, taking a 3.9 Å–wide range centered on the D2 line. The direction of emission is taken with an inclination of 90° with respect to the local vertical (the local vertical is parallel to the symmetry axis of the radiation field). Each of the curves shows the results of calculations that were carried out in the presence of magnetic fields with increasing strength, for various inclinations (see legend) with respect to the local vertical. The curves on the right (left) half of the diagram correspond magnetic fields with positive (negative) longitudinal components (see text). The points upon each curve correspond to field strengths of 5, 10, 20, and 50 G and are marked with triangles, diamonds, stars, and circles, respectively. The point corresponding to the calculation for B = 0 G, where all the curves converge, is marked with the gray cross. The reference direction for positive Stokes Q is perpendicular to the local vertical.
Current usage metrics show cumulative count of Article Views (full-text article views including HTML views, PDF and ePub downloads, according to the available data) and Abstracts Views on Vision4Press platform.
Data correspond to usage on the plateform after 2015. The current usage metrics is available 48-96 hours after online publication and is updated daily on week days.
Initial download of the metrics may take a while.