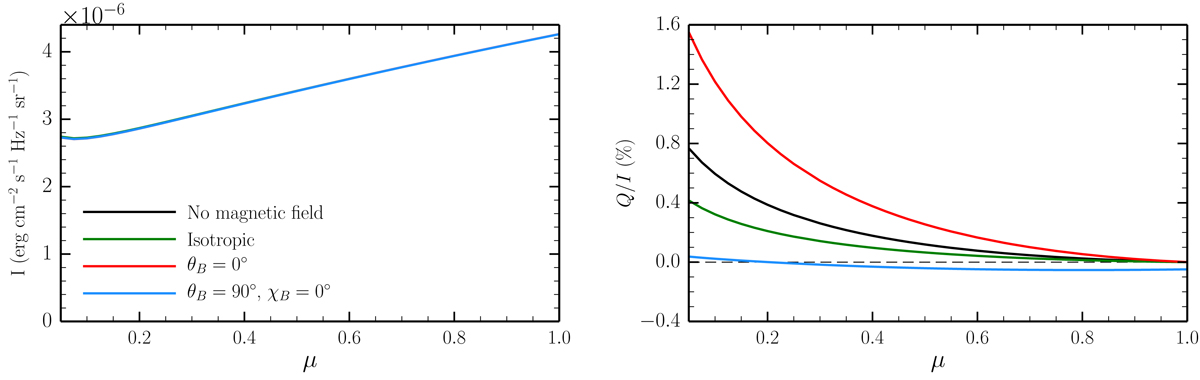
Fig. 15.
Download original image
Center-to-limb variation (CLV) of the Stokes I (left panel) and Q/I (right panel) signal at the wavelength λ0 at the D2 line center. The colored curves correspond to the results of calculations in which 15 G magnetic fields of various orientations were considered, including a microturbulent and isotropic field (green curve) and deterministic magnetic fields, both vertical (θB = 0°; red curve) and horizontal and contained in the plane defined by the local vertical and the LOS (θB = 90°, χB = 0°; blue curve). The CLV obtained in the absence of a magnetic field (black curve) is also shown. The thin black dashed line indicates Q/I = 0.
Current usage metrics show cumulative count of Article Views (full-text article views including HTML views, PDF and ePub downloads, according to the available data) and Abstracts Views on Vision4Press platform.
Data correspond to usage on the plateform after 2015. The current usage metrics is available 48-96 hours after online publication and is updated daily on week days.
Initial download of the metrics may take a while.