Fig. 10.
Download original image
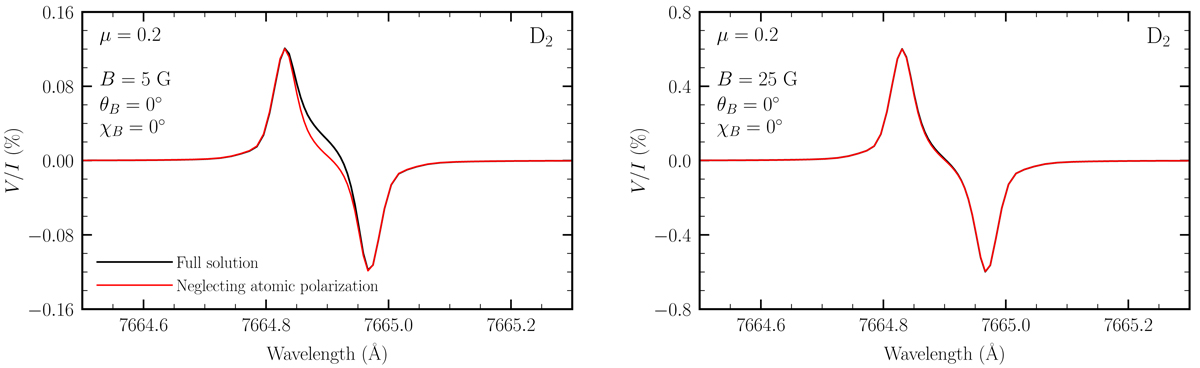
Stokes V/I profiles as a function of wavelength, shown in a range centered on the D2 and calculated in the presence of vertical (θB = 0°) magnetic fields of 5 G (left panel) and 25 G (right panel). The black curves represent the results of RT calculations considering a two-term atomic model with HFS. The red curves represent calculations in which, additionally, all components of the radiation field tensor other than ![]() were set to zero, which effectively suppresses atomic level polarization fully (see text).
were set to zero, which effectively suppresses atomic level polarization fully (see text).
Current usage metrics show cumulative count of Article Views (full-text article views including HTML views, PDF and ePub downloads, according to the available data) and Abstracts Views on Vision4Press platform.
Data correspond to usage on the plateform after 2015. The current usage metrics is available 48-96 hours after online publication and is updated daily on week days.
Initial download of the metrics may take a while.