Fig. 8
Download original image
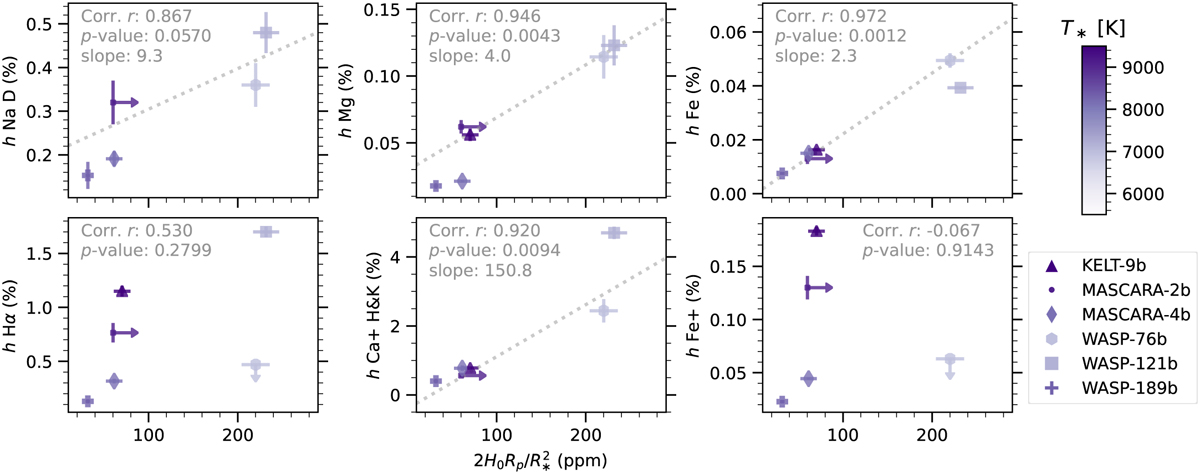
Correlation of observed line strengths (h) of different species with expected transmission strengths of absorbers extending one atmospheric scale height (2H0Rp/R2) for different UHJs. The color saturation of data points represents the temperature of the host star. The data used in this plot are compiled in Table B.1. Planets with high upper limits on mass (e.g. HAT-P-70b) are omitted in the plot. The Pearson correlation coefficients r and the p-values for testing non-correlation are calculated for each species. For metals such as MgI and FeI, r close to 1 and p-value close to 0 indicate strong linear correlation of absorption amplitudes with scale heights. The linear fit to the data points is delineated with dotted gray lines, the slope of which represents the number of scale heights that a certain species probes.
Current usage metrics show cumulative count of Article Views (full-text article views including HTML views, PDF and ePub downloads, according to the available data) and Abstracts Views on Vision4Press platform.
Data correspond to usage on the plateform after 2015. The current usage metrics is available 48-96 hours after online publication and is updated daily on week days.
Initial download of the metrics may take a while.