Fig. 7
Download original image
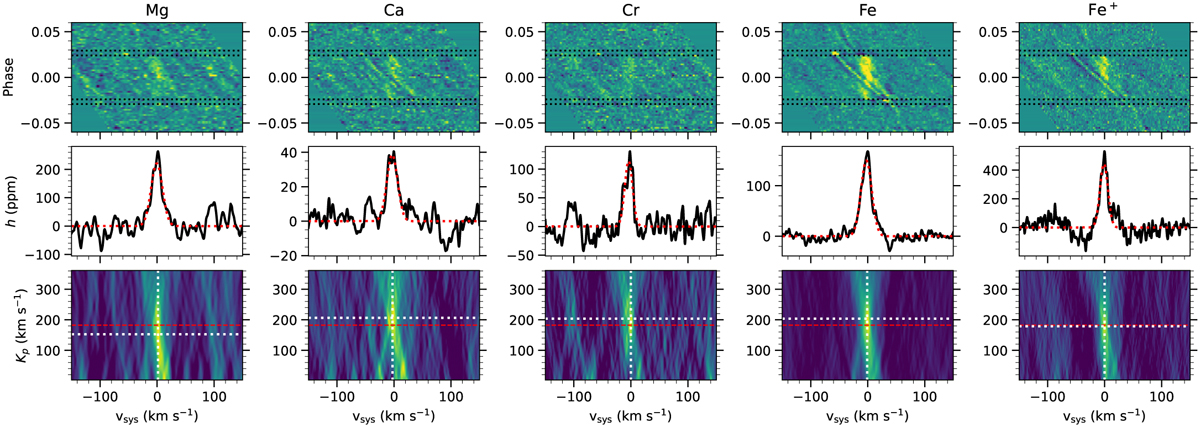
Cross-correlation signatures of Mg I, CaI, Cr I, Fe I, and Fe II, averaged over both nights of observation. Top row: two-dimensional residual cross-correlation functions at the planet rest frame corresponding to the expected orbital velocity Kp. The black dotted lines denote the timings of four transit contacts. The vertical signature in yellow around zero velocity illustrates the planetary transmission signal. The narrow slanted shape is caused by imperfect correction of the stellar RM effect. Middle row: one-dimensional CCF by co-adding all in-transit residual CCFs shown in the top panel. The red dotted line shows the best-fit Gaussian profile to the planetary signal, the parameters of which are summarised in Table 4. Bottom row: a stack of co-added CCFs assuming a range of planetary velocity Kp (in y-axis). The white dotted lines indicate the maximum in the Kp–Vsys map, and the red dashed line marks the expected Kp.
Current usage metrics show cumulative count of Article Views (full-text article views including HTML views, PDF and ePub downloads, according to the available data) and Abstracts Views on Vision4Press platform.
Data correspond to usage on the plateform after 2015. The current usage metrics is available 48-96 hours after online publication and is updated daily on week days.
Initial download of the metrics may take a while.