Open Access
Fig. 6
Download original image
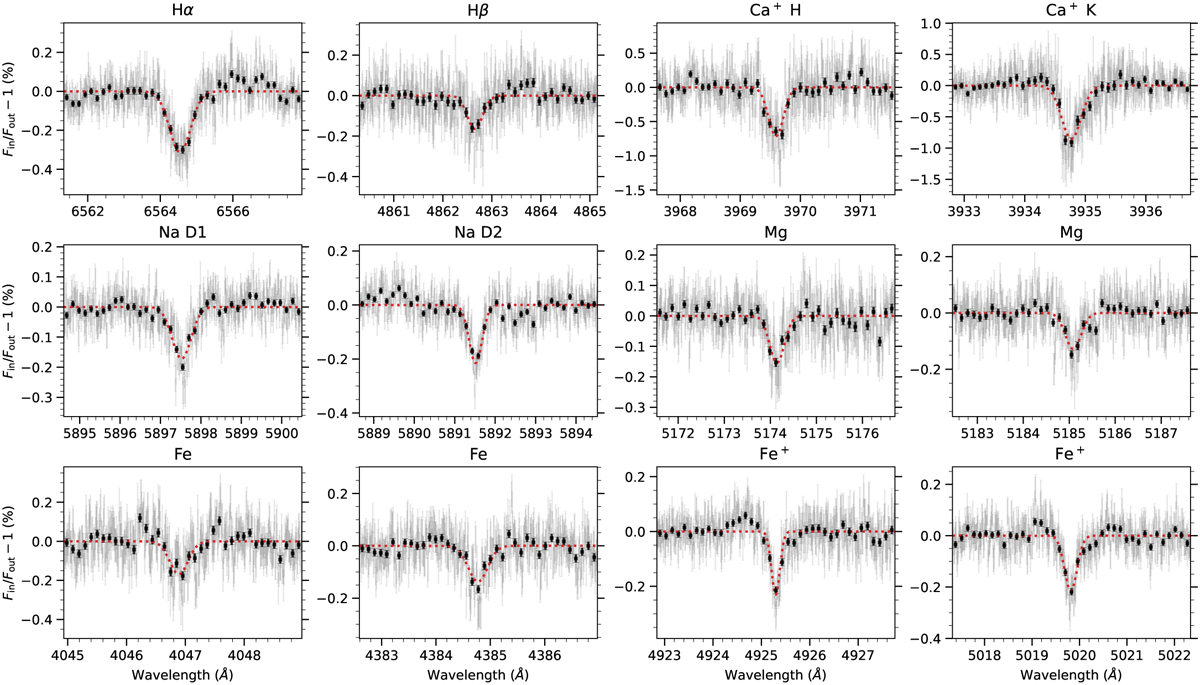
Transmission spectrum around Hα, Hβ, Na I D1&D2, Ca II H&K lines, averaged over both nights of observation. The black points show the transmission spectrum binned every 15 grey data points. The red dotted line shows the best-fit Gaussian profile to the planetary absorption feature.
Current usage metrics show cumulative count of Article Views (full-text article views including HTML views, PDF and ePub downloads, according to the available data) and Abstracts Views on Vision4Press platform.
Data correspond to usage on the plateform after 2015. The current usage metrics is available 48-96 hours after online publication and is updated daily on week days.
Initial download of the metrics may take a while.