Fig. 5
Download original image
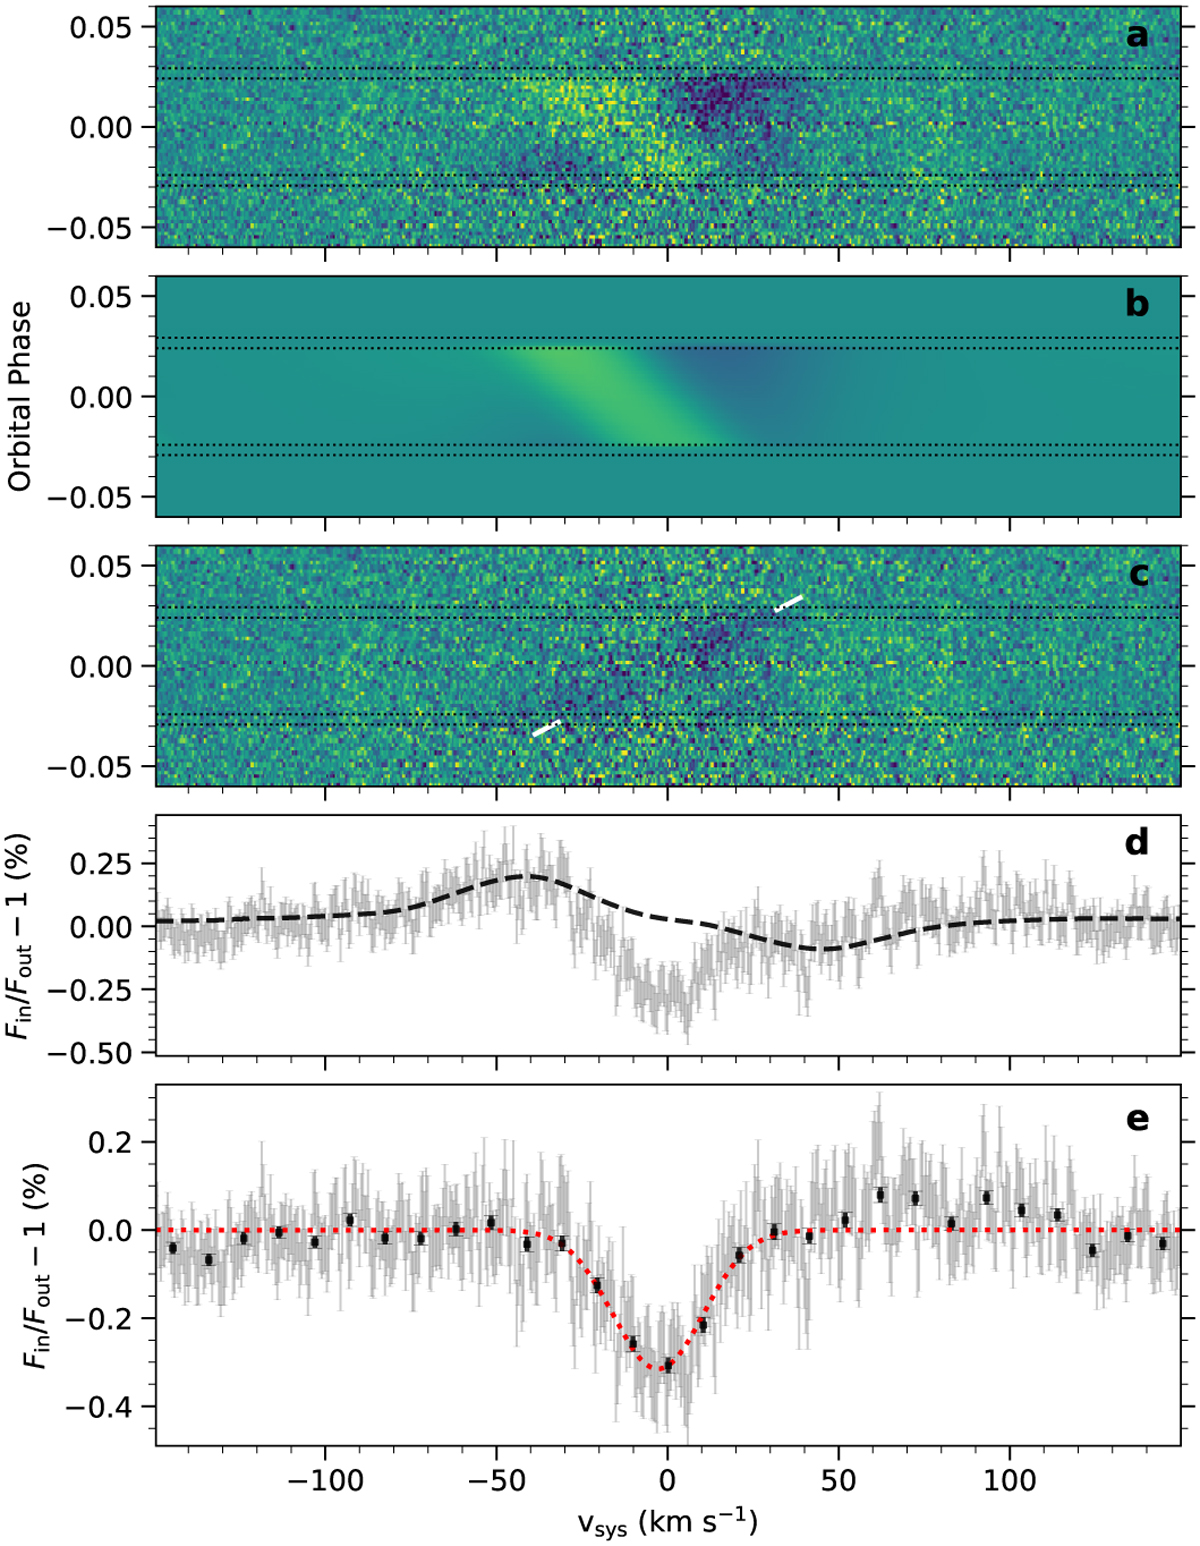
Hα line transmission spectrum analysis of MASCARA-4 b. Panel a: residuals after removing the master out-of-transit spectrum and binning in orbital phase by 0.002, containing the stellar RM+CLV effects and the planetary absorption. Panel b: best-fit RM+CLV model to the data in panel a. Panel c: difference between the data (in panel a) and the RM+ CLV model (in panel b) to isolate the planetary absorption signal, as traced by the slanted white line. Panel d: transmission spectrum in grey obtained by average-combining the in-transit residuals in panel a (without the correction of RM+CLV effects) in the planet rest frame. The black dashed line is the RM+ CLV model in panel b combined in the planet rest frame. Panel e: transmission spectrum in grey obtained by average-combining the cleaned residuals in panel c in the planet rest frame. The black points show the transmission spectrum binned every 15 data points. The red dotted line shows the best-fit Gaussian profile to the planetary absorption feature of Hα.
Current usage metrics show cumulative count of Article Views (full-text article views including HTML views, PDF and ePub downloads, according to the available data) and Abstracts Views on Vision4Press platform.
Data correspond to usage on the plateform after 2015. The current usage metrics is available 48-96 hours after online publication and is updated daily on week days.
Initial download of the metrics may take a while.