Open Access
Fig. 3
Download original image
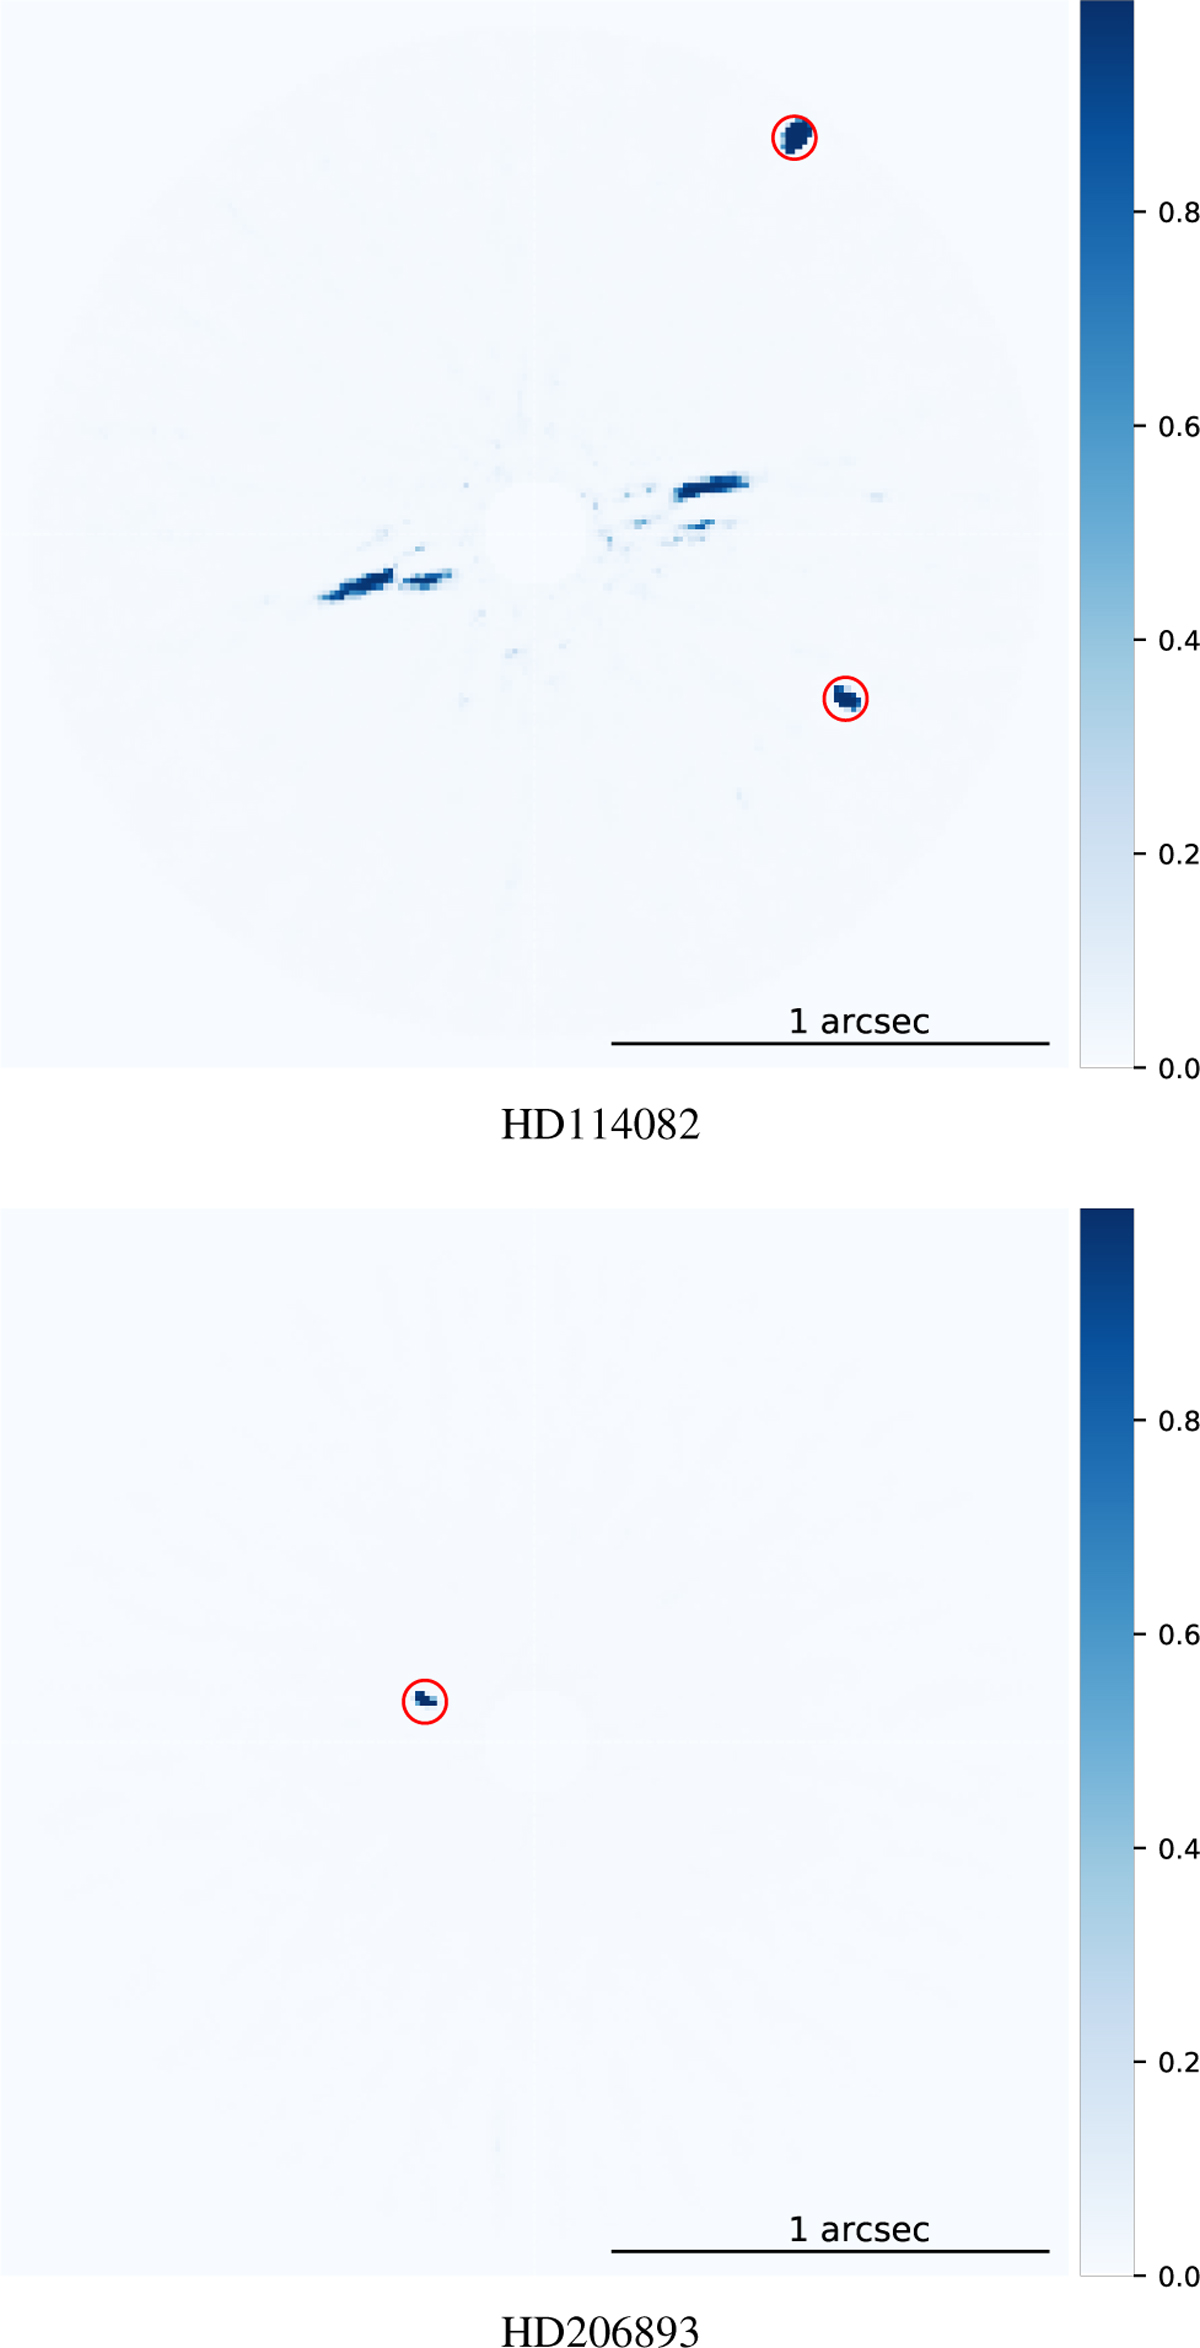
RSM detection maps generated using Auto-RSM. These detection maps led to the detection of one or multiple planetary candidates. The color scale is expressed in terms of inferred detection probabilities. A square root scale has been selected to highlight potential residual speckle noise.
Current usage metrics show cumulative count of Article Views (full-text article views including HTML views, PDF and ePub downloads, according to the available data) and Abstracts Views on Vision4Press platform.
Data correspond to usage on the plateform after 2015. The current usage metrics is available 48-96 hours after online publication and is updated daily on week days.
Initial download of the metrics may take a while.