Open Access
Fig. B.1
Download original image
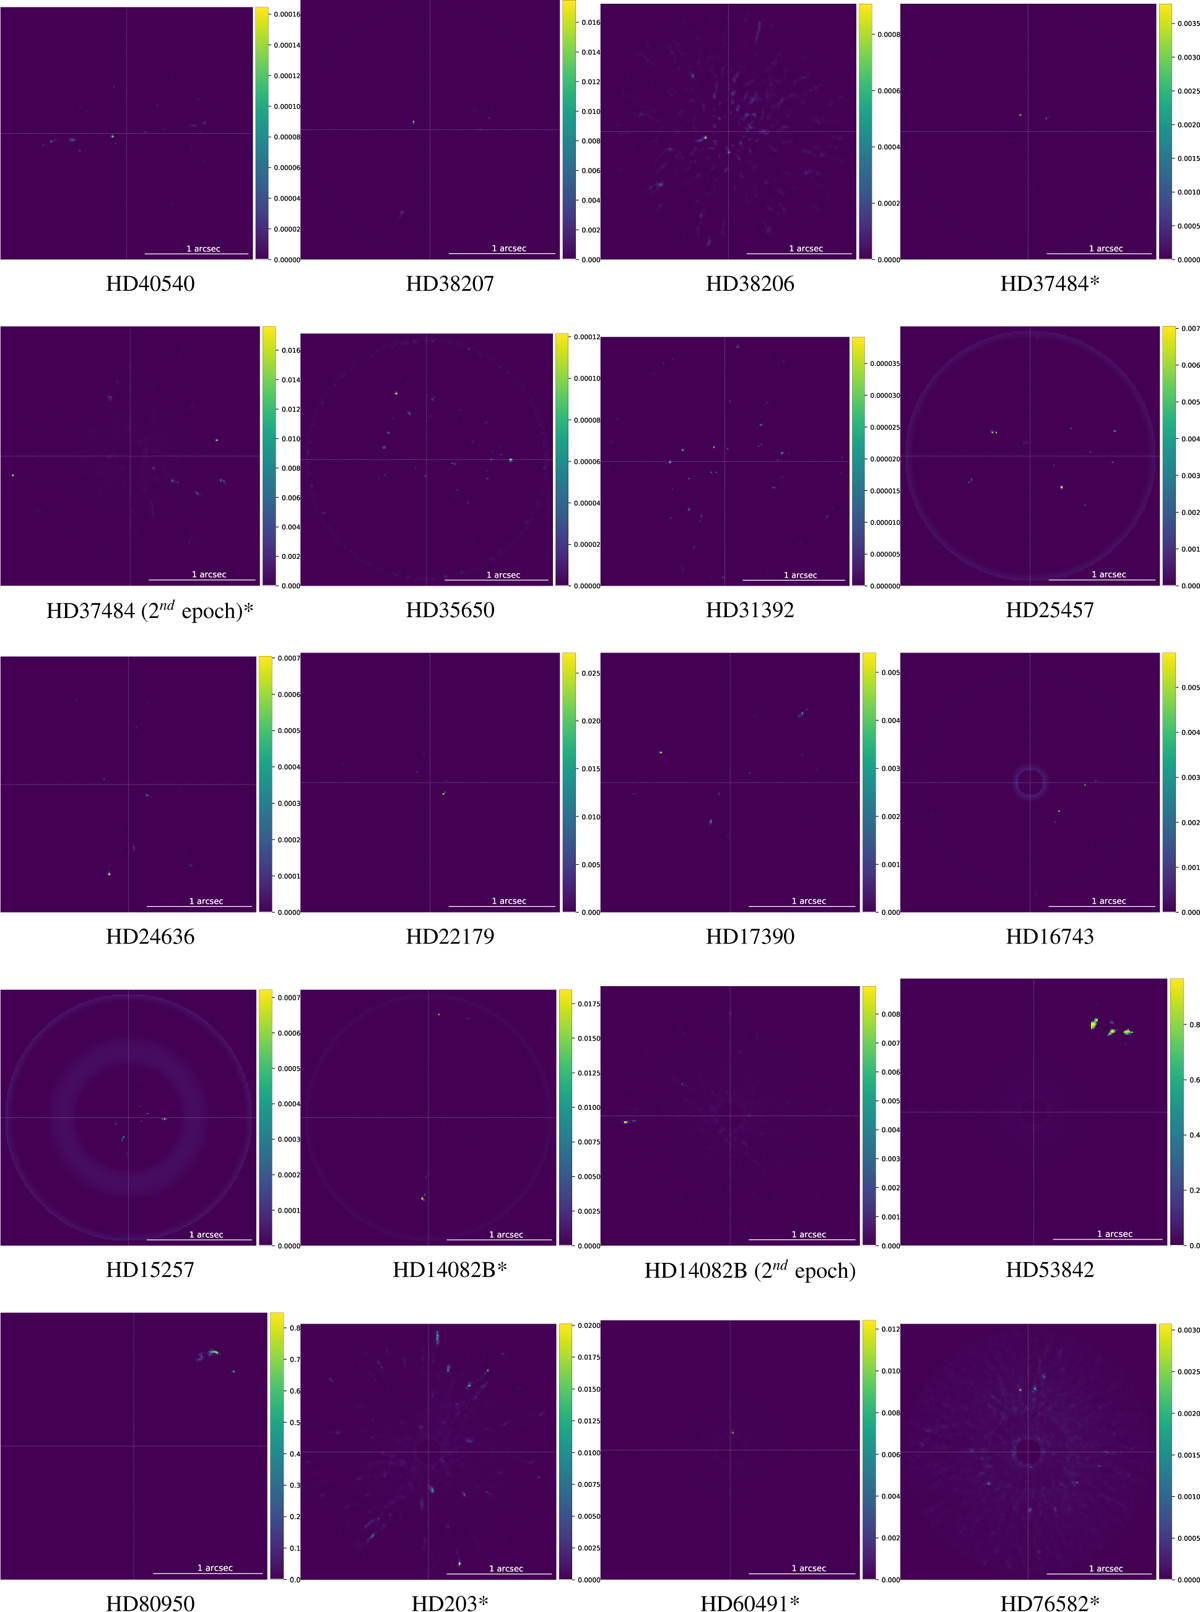
RSM detection maps generated using auto-RSM or the optimal parameters obtained with auto-RSM for the dataset at the center of the clusters (see Table 2)). These detection maps did not lead to the detection of a target. The asterisks indicate the targets on which the full Auto-RSM framework was applied.
Current usage metrics show cumulative count of Article Views (full-text article views including HTML views, PDF and ePub downloads, according to the available data) and Abstracts Views on Vision4Press platform.
Data correspond to usage on the plateform after 2015. The current usage metrics is available 48-96 hours after online publication and is updated daily on week days.
Initial download of the metrics may take a while.