Open Access
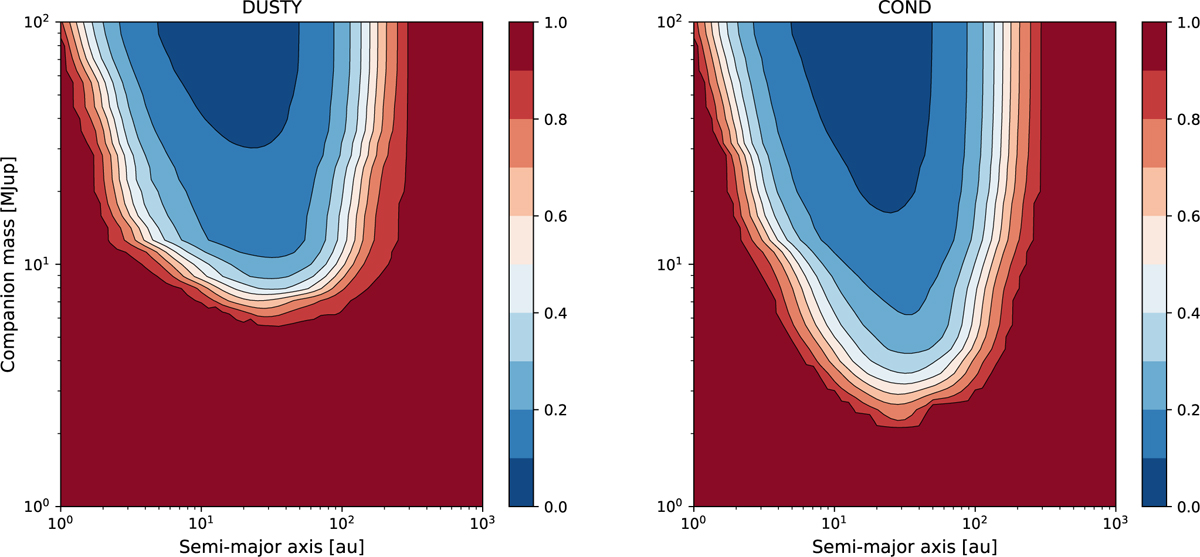
Fig. 14
Download original image
95% confidence upper limits on the planet occurrence rate as function of companion mass and semi-major axis. The contour plots are calculated using the AMES-COND and AMES-DUSTY evolutionary models, relying on the contrast curves generated for the 53 targets of the SHARDDS survey.
Current usage metrics show cumulative count of Article Views (full-text article views including HTML views, PDF and ePub downloads, according to the available data) and Abstracts Views on Vision4Press platform.
Data correspond to usage on the plateform after 2015. The current usage metrics is available 48-96 hours after online publication and is updated daily on week days.
Initial download of the metrics may take a while.