Fig. 12
Download original image
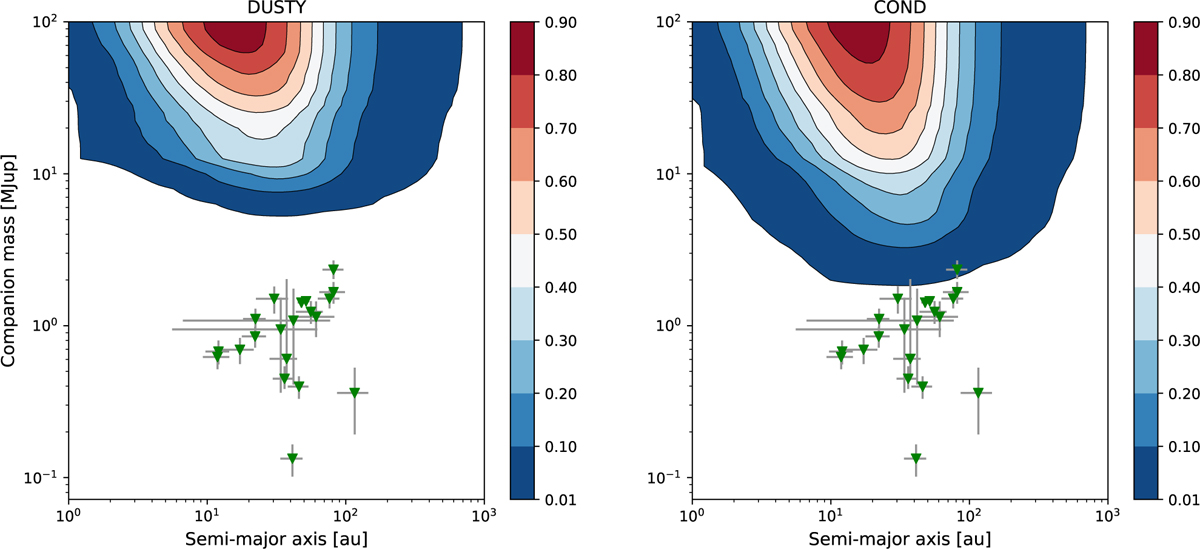
Detection probability as function of companion mass and semi-major axis. The contour plots have been calculated using the AMES-COND and AMES-DUSTY evolutionary models, relying on the contrast curves generated for the 53 targets of the SHARDDS survey (Fomalhaut C and HD 107649 have been rejected due to respectively adverse observing conditions and the presence of extended bright structures). The estimated mass and semi-major axis estimated for 21 targets of the SHARDDS survey by Pearce et al. (2022) are injected in the probability map along with the associated uncertainties.
Current usage metrics show cumulative count of Article Views (full-text article views including HTML views, PDF and ePub downloads, according to the available data) and Abstracts Views on Vision4Press platform.
Data correspond to usage on the plateform after 2015. The current usage metrics is available 48-96 hours after online publication and is updated daily on week days.
Initial download of the metrics may take a while.