Fig. 8
Download original image
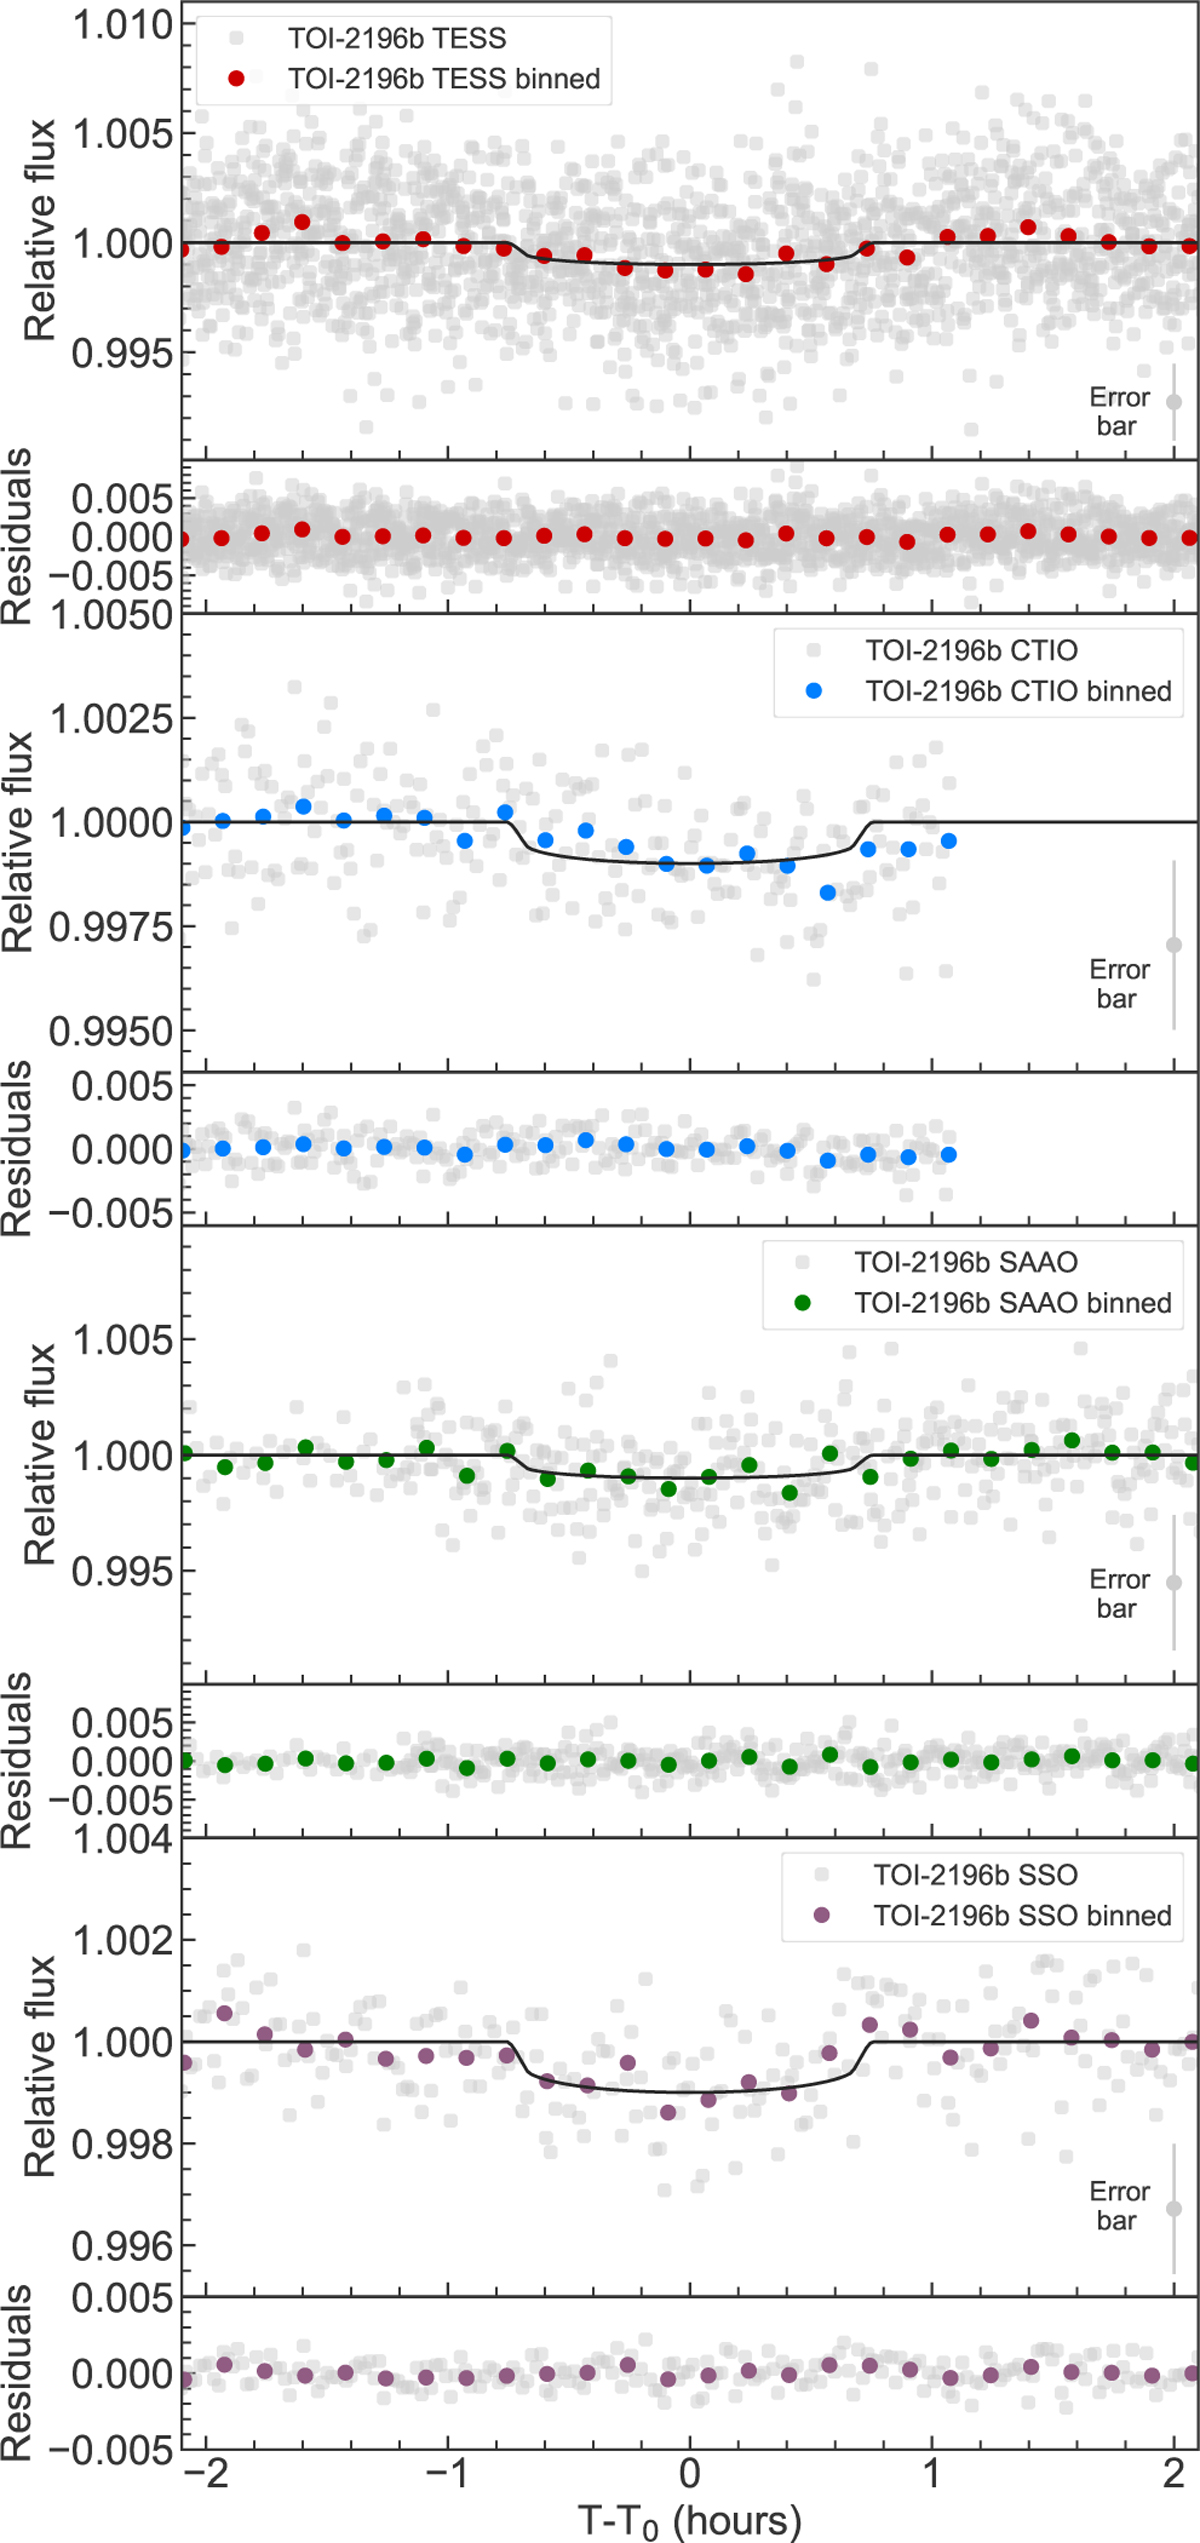
Flattened and phase-folded TESS light curve with the best-fitting transit model in black in the top panel, and follow-up photometry from ground performed with the LCOGT CTIO, SAAO, and SSO telescopes in the second to fourth panels as marked in the legends. The CTIO and SSO panels show the single transits those facilities observed, while the SAAO panel shows the two stacked transits detected with that telescope. The nominal short cadence data are plotted in grey in all panels and binned to 10 min in colour.
Current usage metrics show cumulative count of Article Views (full-text article views including HTML views, PDF and ePub downloads, according to the available data) and Abstracts Views on Vision4Press platform.
Data correspond to usage on the plateform after 2015. The current usage metrics is available 48-96 hours after online publication and is updated daily on week days.
Initial download of the metrics may take a while.