Fig. 5
Download original image
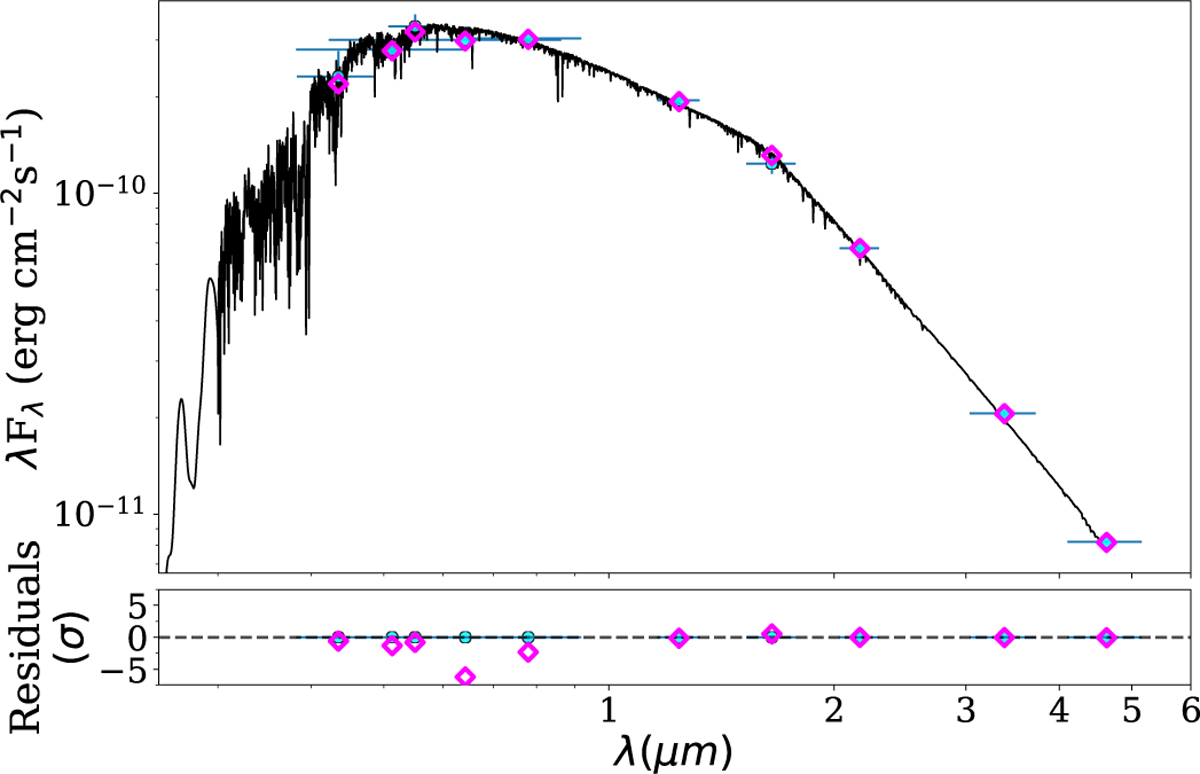
Spectral energy distribution (SED) of TOI-2196 and the model with highest probability from Husser et al. (2013, Phoenix v2). We plot the synthetic photometry with magenta diamonds and the observed photometry with blue points. The 1 σ uncertainties are shown with vertical error bars, while the horizontal bars display the effective width of the passbands. In the lower panel we show the residuals normalised to the errors of the photometry.
Current usage metrics show cumulative count of Article Views (full-text article views including HTML views, PDF and ePub downloads, according to the available data) and Abstracts Views on Vision4Press platform.
Data correspond to usage on the plateform after 2015. The current usage metrics is available 48-96 hours after online publication and is updated daily on week days.
Initial download of the metrics may take a while.