Fig. 4
Download original image
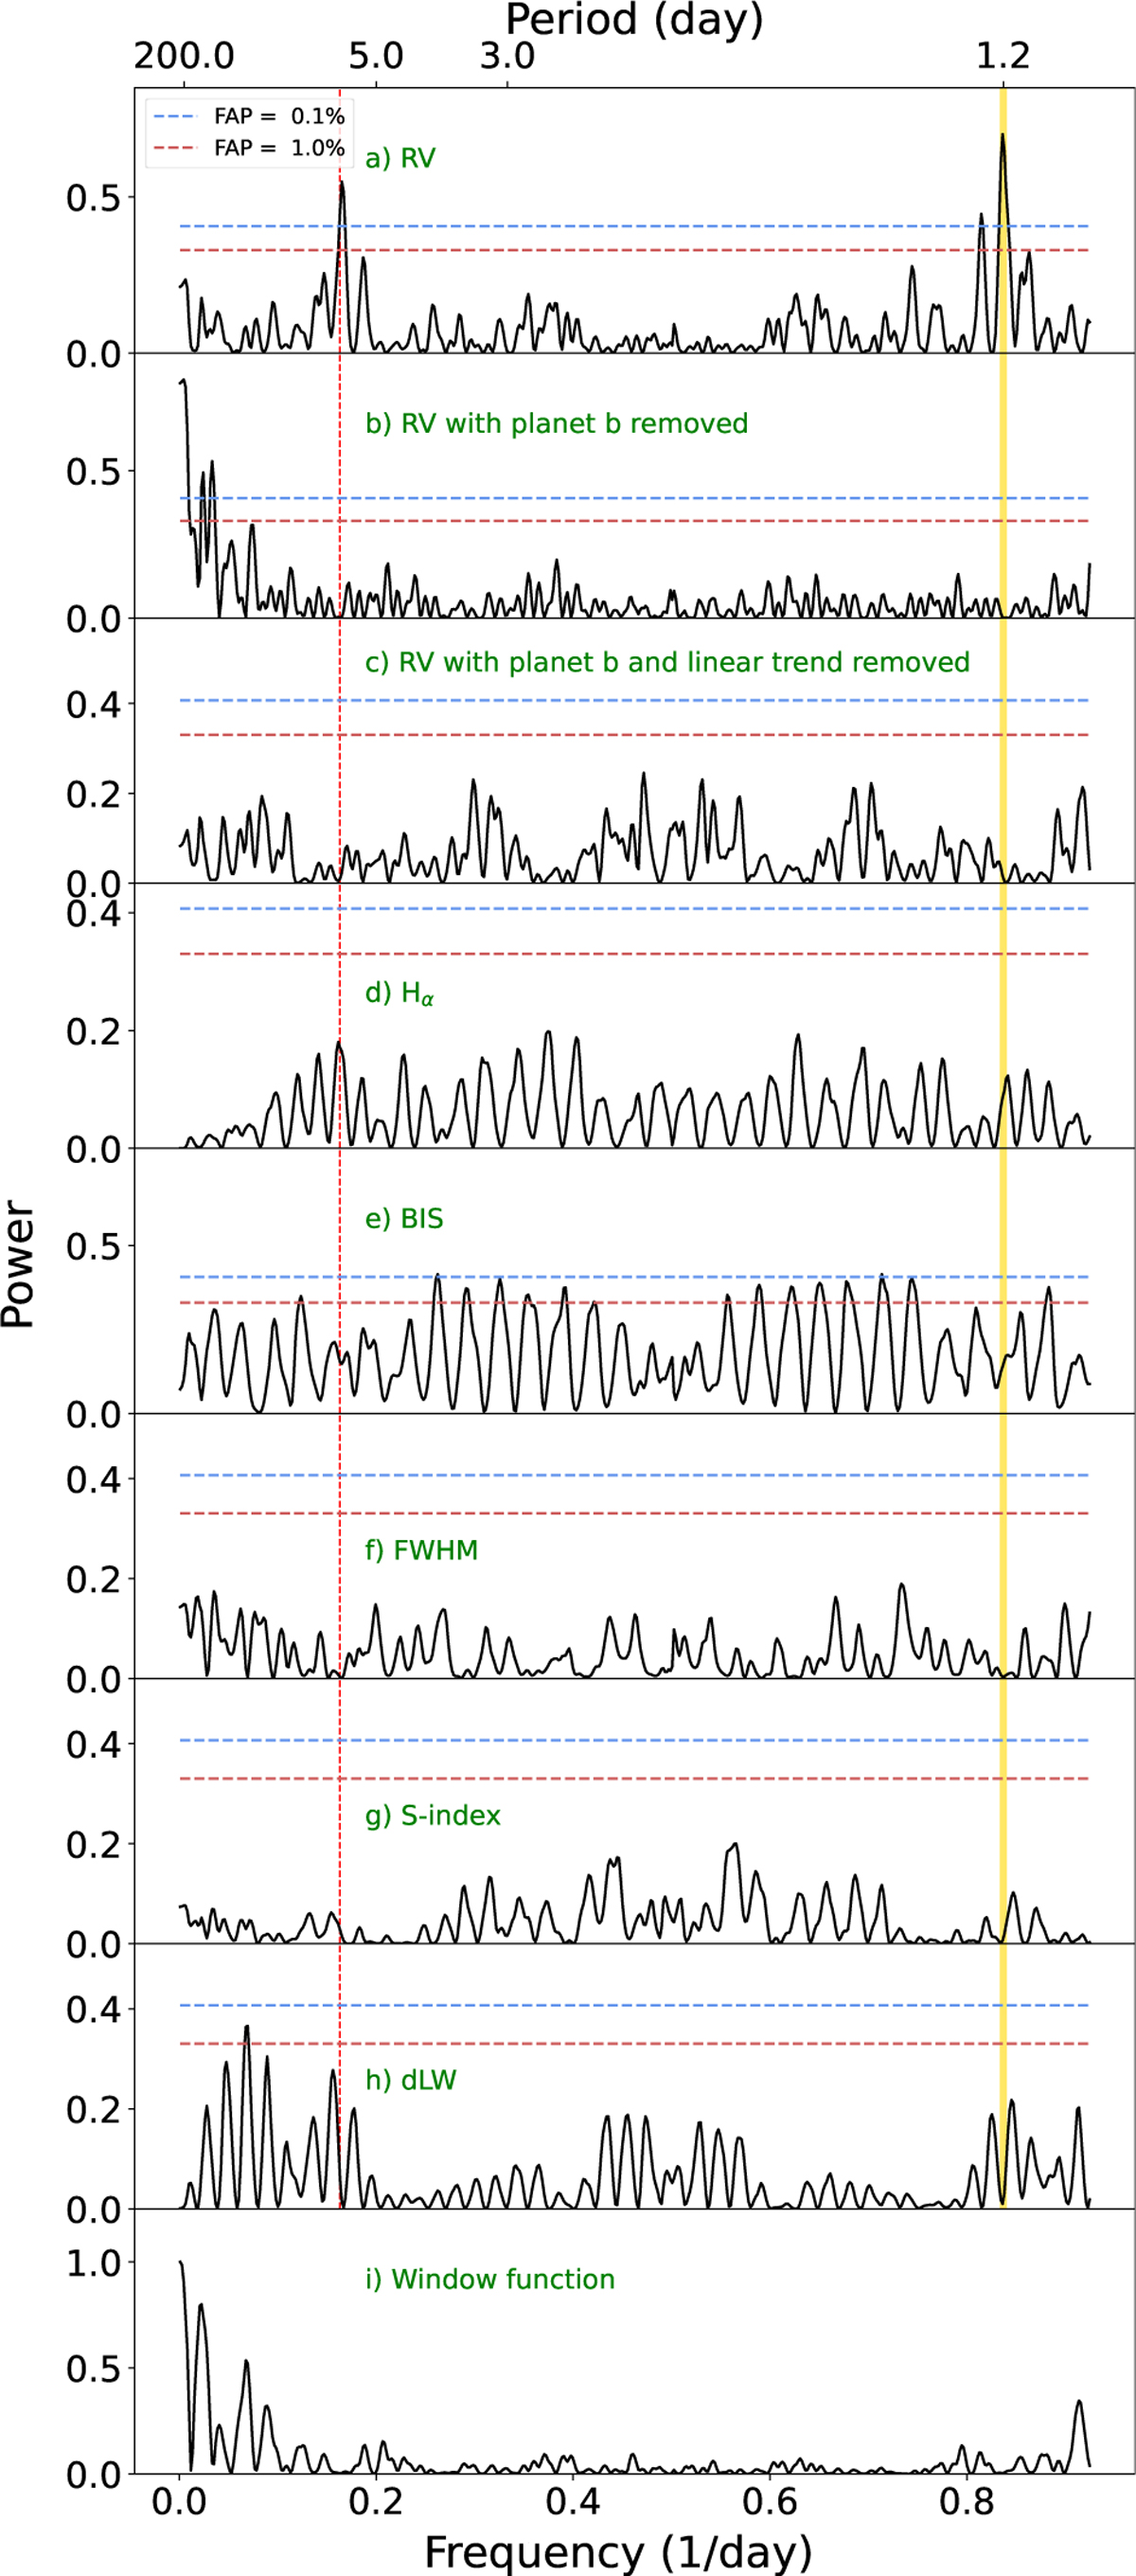
Generalised Lomb–Scargle periodogram of the HARPS RVs and stellar activity indicators. The horizontal lines mark the bootstrap false alarm probabilities at 0.1 and 1.0% as indicated in the legend. The orbital frequency of TOI-2196 b (vb = 0.837 day−1) is marked with a vertical thick yellow line, while the corresponding period is reported in the upper x-axis (Porb ≈ 1.2 day). The 1 day alias of planet b is marked with a vertical dashed red line (1 − 0.837 = 0.163 day−1), a) RV measurements, b) RV residuals with the best-fitting Keplerian orbit of planet b subtracted, c) RV residuals following the subtraction of both the linear trend and the Doppler signal induced by planet b. d–h) Activity indicators and line profile variations, i) The window function.
Current usage metrics show cumulative count of Article Views (full-text article views including HTML views, PDF and ePub downloads, according to the available data) and Abstracts Views on Vision4Press platform.
Data correspond to usage on the plateform after 2015. The current usage metrics is available 48-96 hours after online publication and is updated daily on week days.
Initial download of the metrics may take a while.