Fig. 2
Download original image
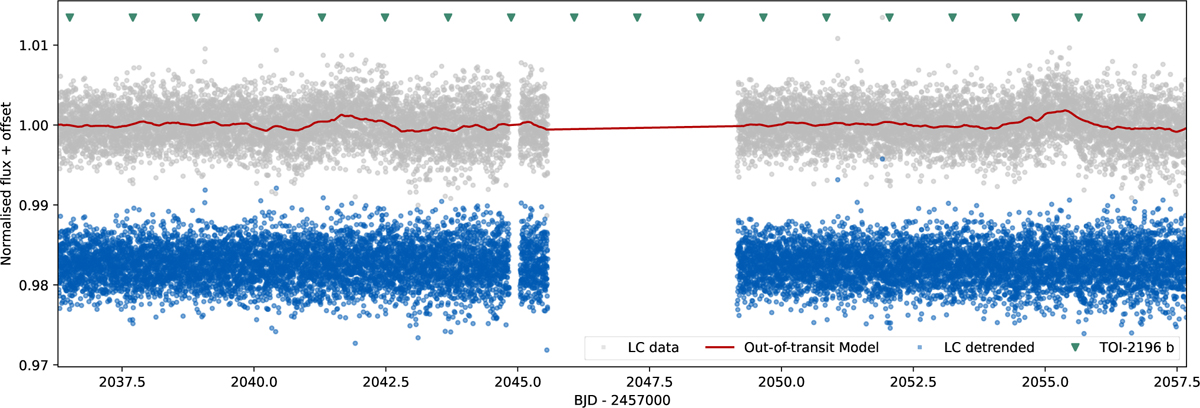
TESS light curve for sector 27 (short cadence) is plotted in grey with the Gaussian Process model of the out-of-transit data overplotted in red. The detrended and normalised light curve is shown in blue, and, for the purposes of visualisation, a vertical offset has been applied. The triangles mark the locations of the individual transits of TOI-2196 b.
Current usage metrics show cumulative count of Article Views (full-text article views including HTML views, PDF and ePub downloads, according to the available data) and Abstracts Views on Vision4Press platform.
Data correspond to usage on the plateform after 2015. The current usage metrics is available 48-96 hours after online publication and is updated daily on week days.
Initial download of the metrics may take a while.