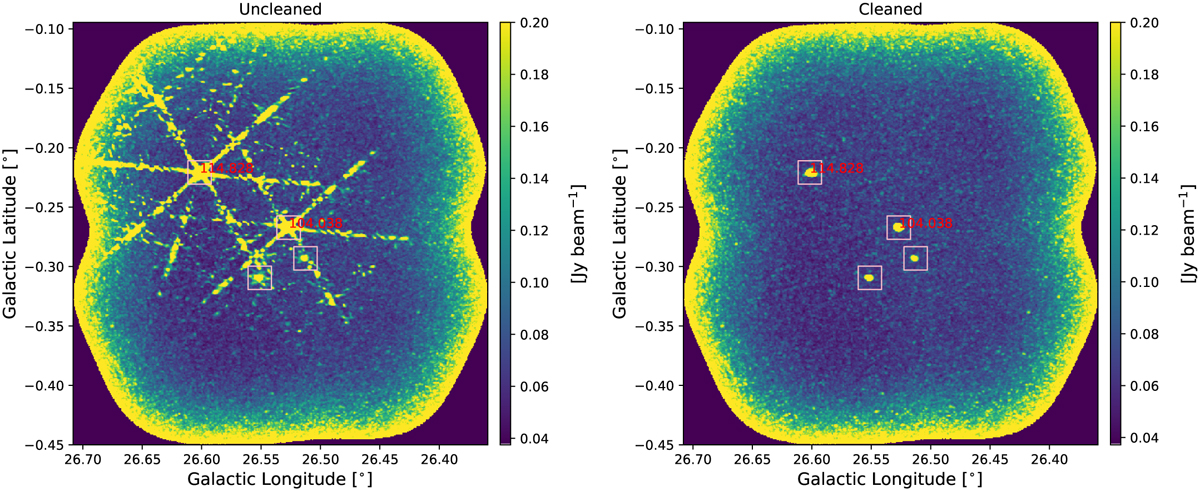
Fig. 3

Download original image
Example of the Source Extraction Code (SEC) on unCLEANed and CLEANed data sub-cubes. Left: example peak intensity map of a dirty sub-cube towards l = 26.5270 deg, b = –0.2674 deg which is an example of the data used when making preliminary detection catalogues with our SEC. Velocities of known sources are shown in red text, while pink squares highlight the final source detections. In this “dirty” image, the bottom two sources would not have been detected. Right: once we CLEAN the image, we can see how the two bottom sources would indeed be detected by our SEC and, as such, illustrates how running the SEC again on the cleaned sub-cubes can lead to new detections.
Current usage metrics show cumulative count of Article Views (full-text article views including HTML views, PDF and ePub downloads, according to the available data) and Abstracts Views on Vision4Press platform.
Data correspond to usage on the plateform after 2015. The current usage metrics is available 48-96 hours after online publication and is updated daily on week days.
Initial download of the metrics may take a while.


