Fig. A.1
Download original image
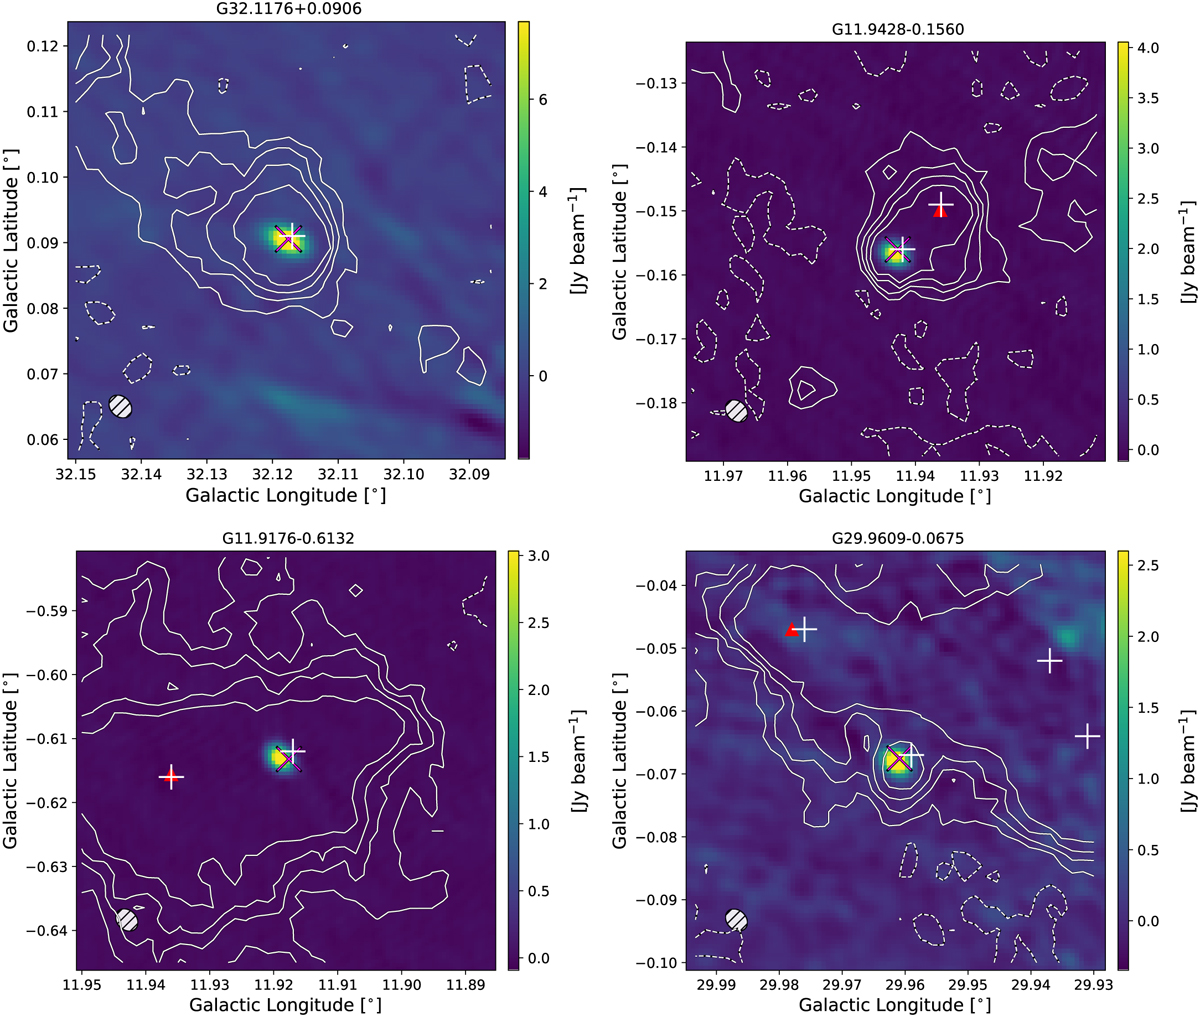
GLOSTAR 6.7 GHz emission maps at the velocity of the maser emission peak of the ten strongest new masers, denoted by the magenta ‘X’. Red triangles denote the position of known MMB masers. The flux levels were limited to 75% of the maser peak to better illustrate low intensity features. The white “+” signs show the positions of known compact ATLASGAL sources and the white contours are from the ATLASGAL 870µm dust emission map with contour levels at −3, 3, 5, 7, and 10 σ noise levels.
Current usage metrics show cumulative count of Article Views (full-text article views including HTML views, PDF and ePub downloads, according to the available data) and Abstracts Views on Vision4Press platform.
Data correspond to usage on the plateform after 2015. The current usage metrics is available 48-96 hours after online publication and is updated daily on week days.
Initial download of the metrics may take a while.