Fig. 26
Download original image
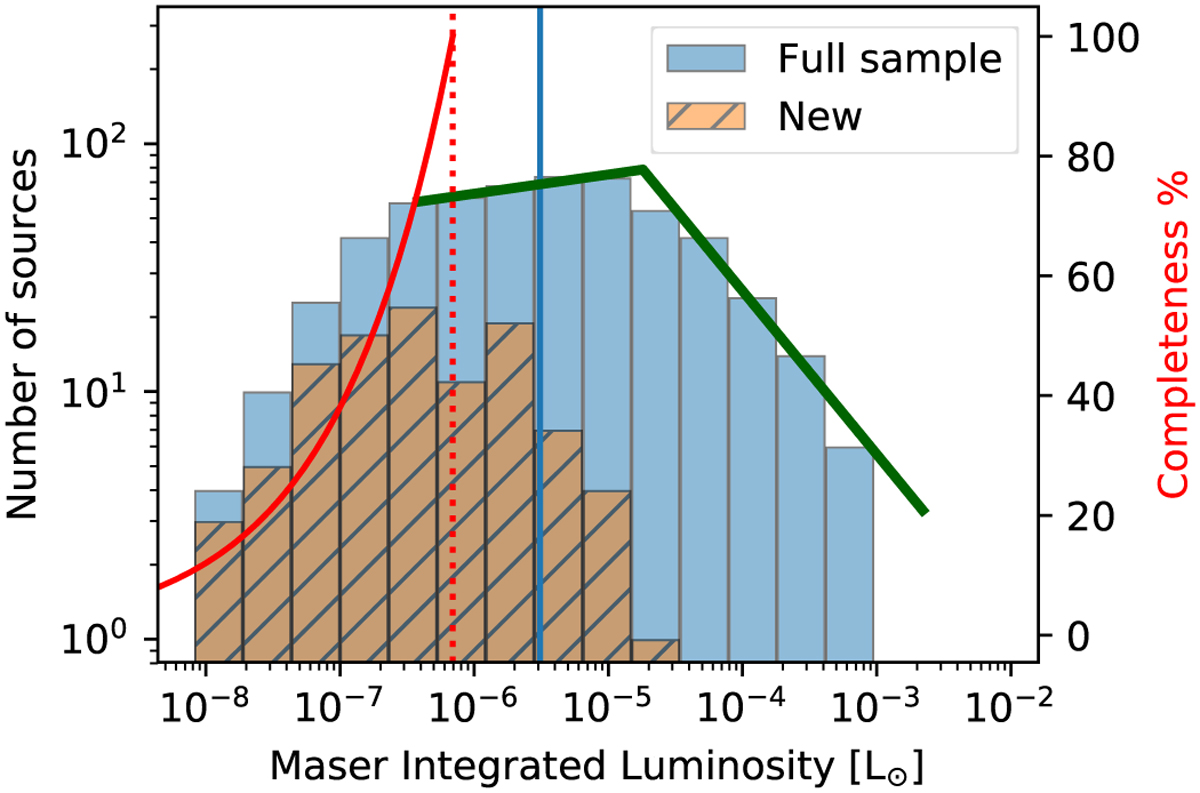
Distribution of luminosities derived. The blue vertical line represents the median value of 3.1 × 10⁻⁶ L⊙. The subset of new detections peaks at a lower luminosity as expected. The red curve corresponds to the completeness level with values on the right axis, and the dotted red line indicates the level of 100% completeness. The two green lines represent the broken power law fit with powers of 0.08 ± 0.05 for the lower luminosity range and −0.66 ± 0.05 for the upper luminosity range.
Current usage metrics show cumulative count of Article Views (full-text article views including HTML views, PDF and ePub downloads, according to the available data) and Abstracts Views on Vision4Press platform.
Data correspond to usage on the plateform after 2015. The current usage metrics is available 48-96 hours after online publication and is updated daily on week days.
Initial download of the metrics may take a while.