Fig. 24
Download original image
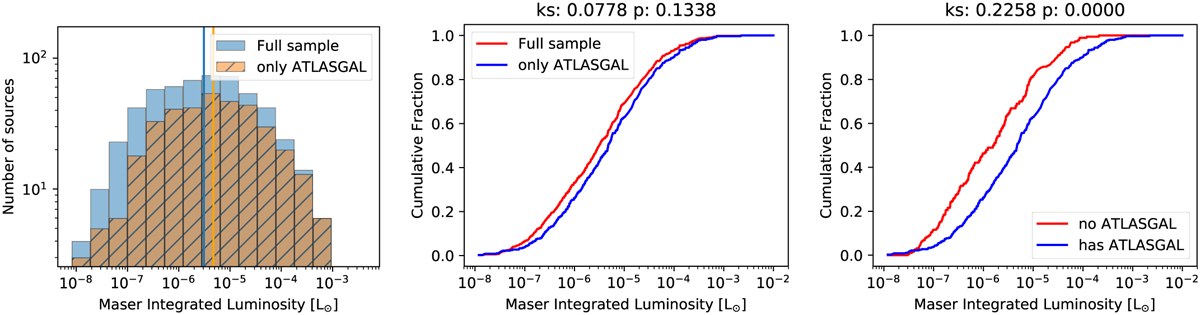
Comparison of the luminosities of sources with and without association with ATLASGAL sources. Left: shown is the distribution of the luminosities. The median value is 3.1 × 10⁻⁶ L⊙ for the full sample and 4.7 × 10⁻⁶ L⊙ and the subset of detections peaks that have ATLASGAL compact source catalogue (CSC) associations. Middle: CDF comparing the full sample of luminosities to the subset of sources that are associated with ATLASGAL where the two samples are not distinct. Right: CDF comparing the sample of luminosities without an ATLASGAL association to those with where they are seen to be statistically distinct.
Current usage metrics show cumulative count of Article Views (full-text article views including HTML views, PDF and ePub downloads, according to the available data) and Abstracts Views on Vision4Press platform.
Data correspond to usage on the plateform after 2015. The current usage metrics is available 48-96 hours after online publication and is updated daily on week days.
Initial download of the metrics may take a while.