Fig. 22
Download original image
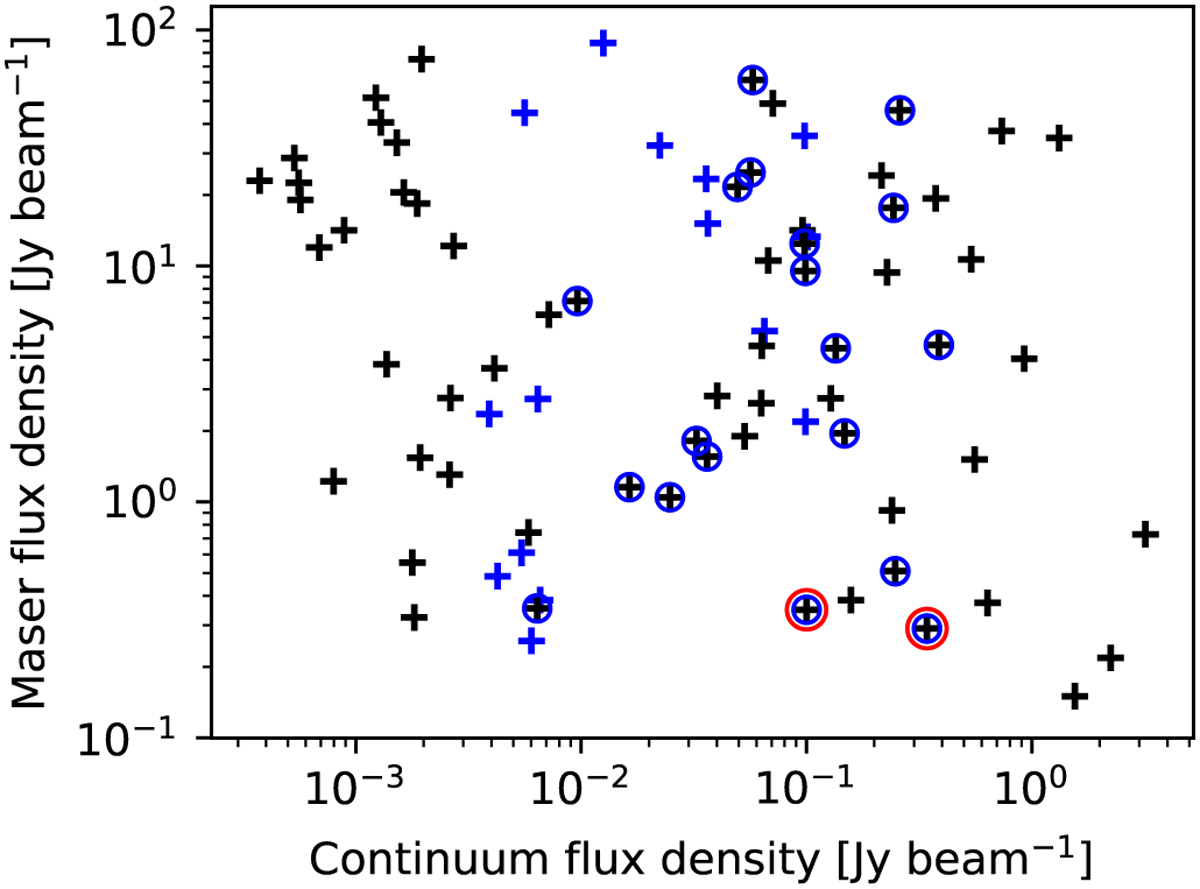
Maser flux density against radio continuum flux density. Black crosses correspond to GLOSTAR D-configuration values for the radio continuum whereas blue crosses correspond to CORNISH B-configuration values. Blue circles show the sources that have counterparts in both continuum catalogues, but are plotted with the GLOSTAR flux density. Red circles denote sources that are new maser detections.
Current usage metrics show cumulative count of Article Views (full-text article views including HTML views, PDF and ePub downloads, according to the available data) and Abstracts Views on Vision4Press platform.
Data correspond to usage on the plateform after 2015. The current usage metrics is available 48-96 hours after online publication and is updated daily on week days.
Initial download of the metrics may take a while.