Fig. 21
Download original image
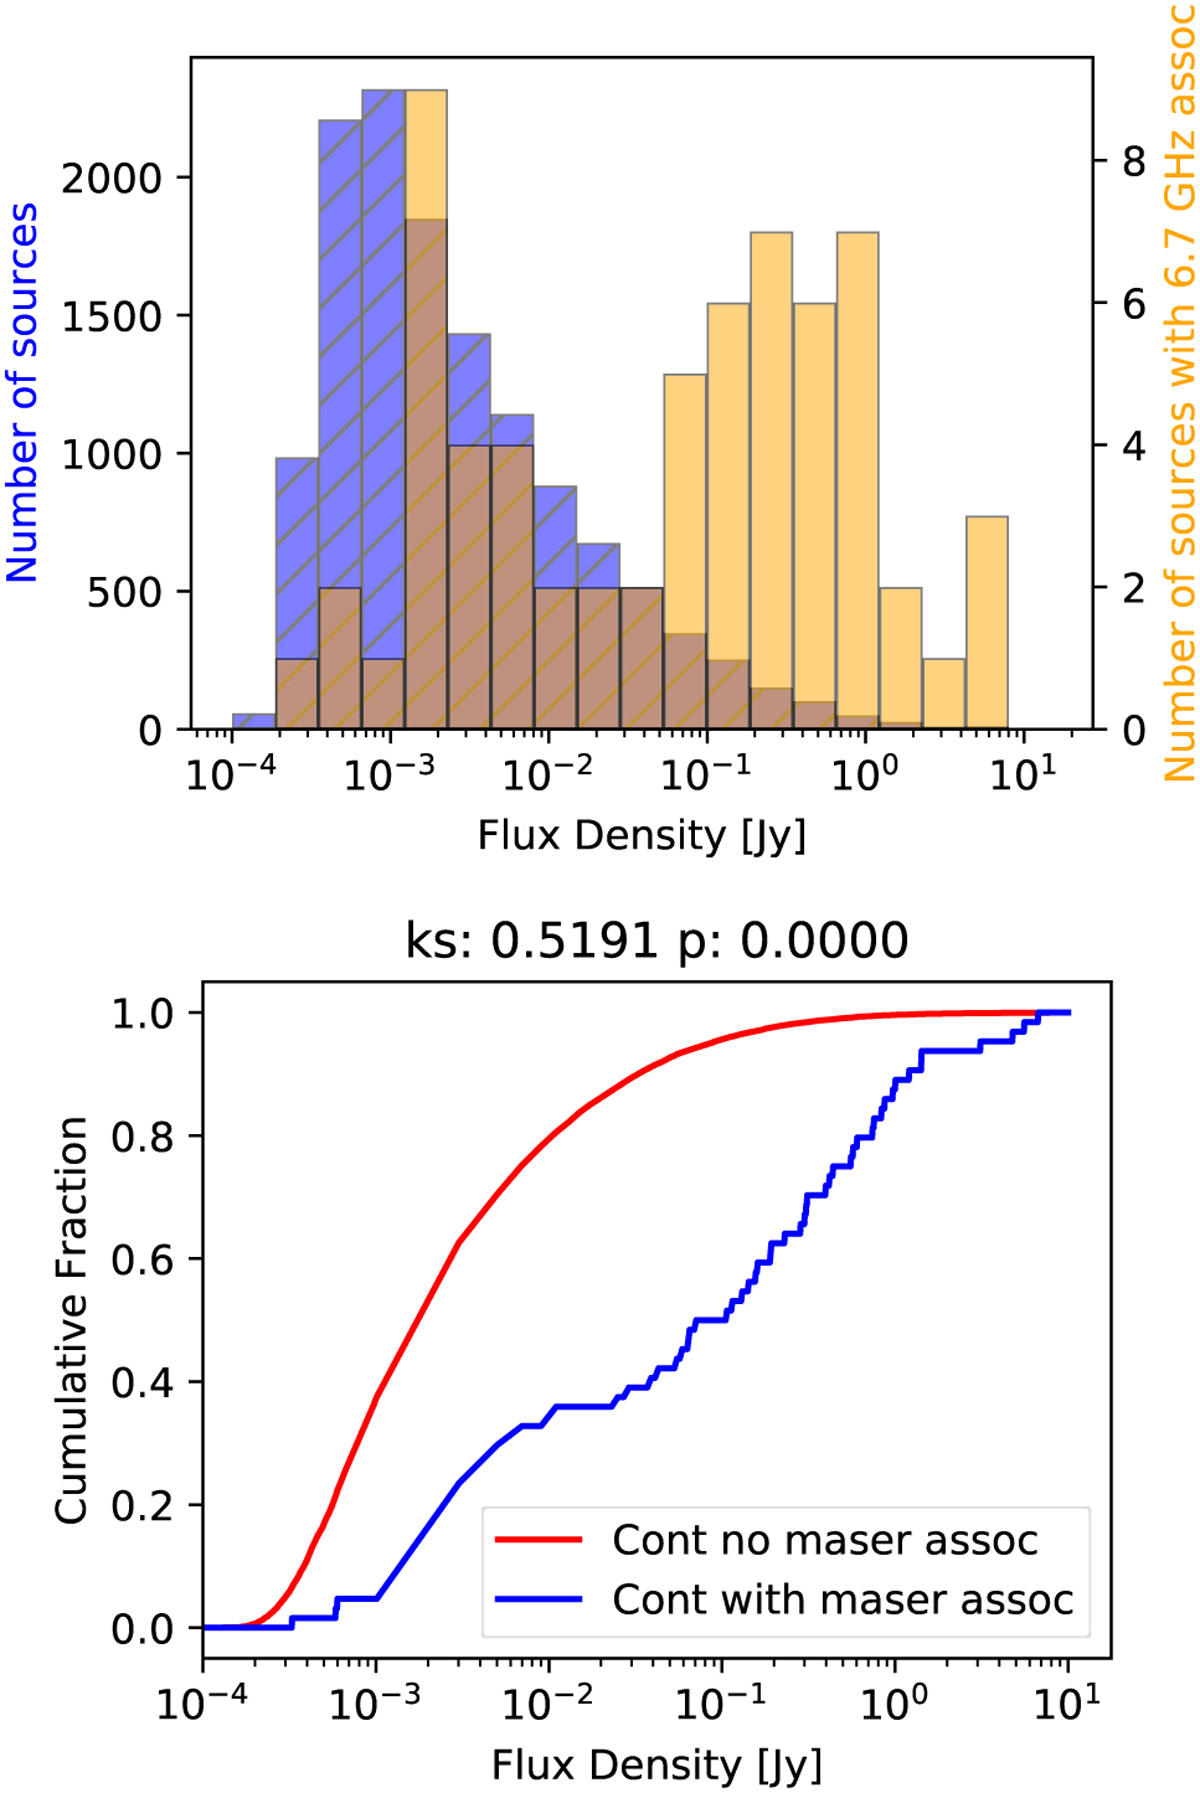
Flux density comparison between maser associated continuum sources and those without. Top: blue hatched histogram shows the flux distribution of the GLOSTAR D-configuration continuum sources (Medina et al. 2019, and in prep.). The orange histogram shows the distribution of the radio sources that are associated with GLOSTAR 6.7 GHz methanol masers and has been rescaled for better visibility (the axis is indicated on the right). Bottom: CDFs for the flux density of radio continuum sources that have 6.7 GHz methanol maser associations (blue) and those without (red). The result of the Kolmogorov-Smirnov test is reported above the figure and indicates that both distributions are distinct, with continuum sources associated with methanol masers typically being stronger than the overall distribution of continuum sources.
Current usage metrics show cumulative count of Article Views (full-text article views including HTML views, PDF and ePub downloads, according to the available data) and Abstracts Views on Vision4Press platform.
Data correspond to usage on the plateform after 2015. The current usage metrics is available 48-96 hours after online publication and is updated daily on week days.
Initial download of the metrics may take a while.