Fig. 2
Download original image
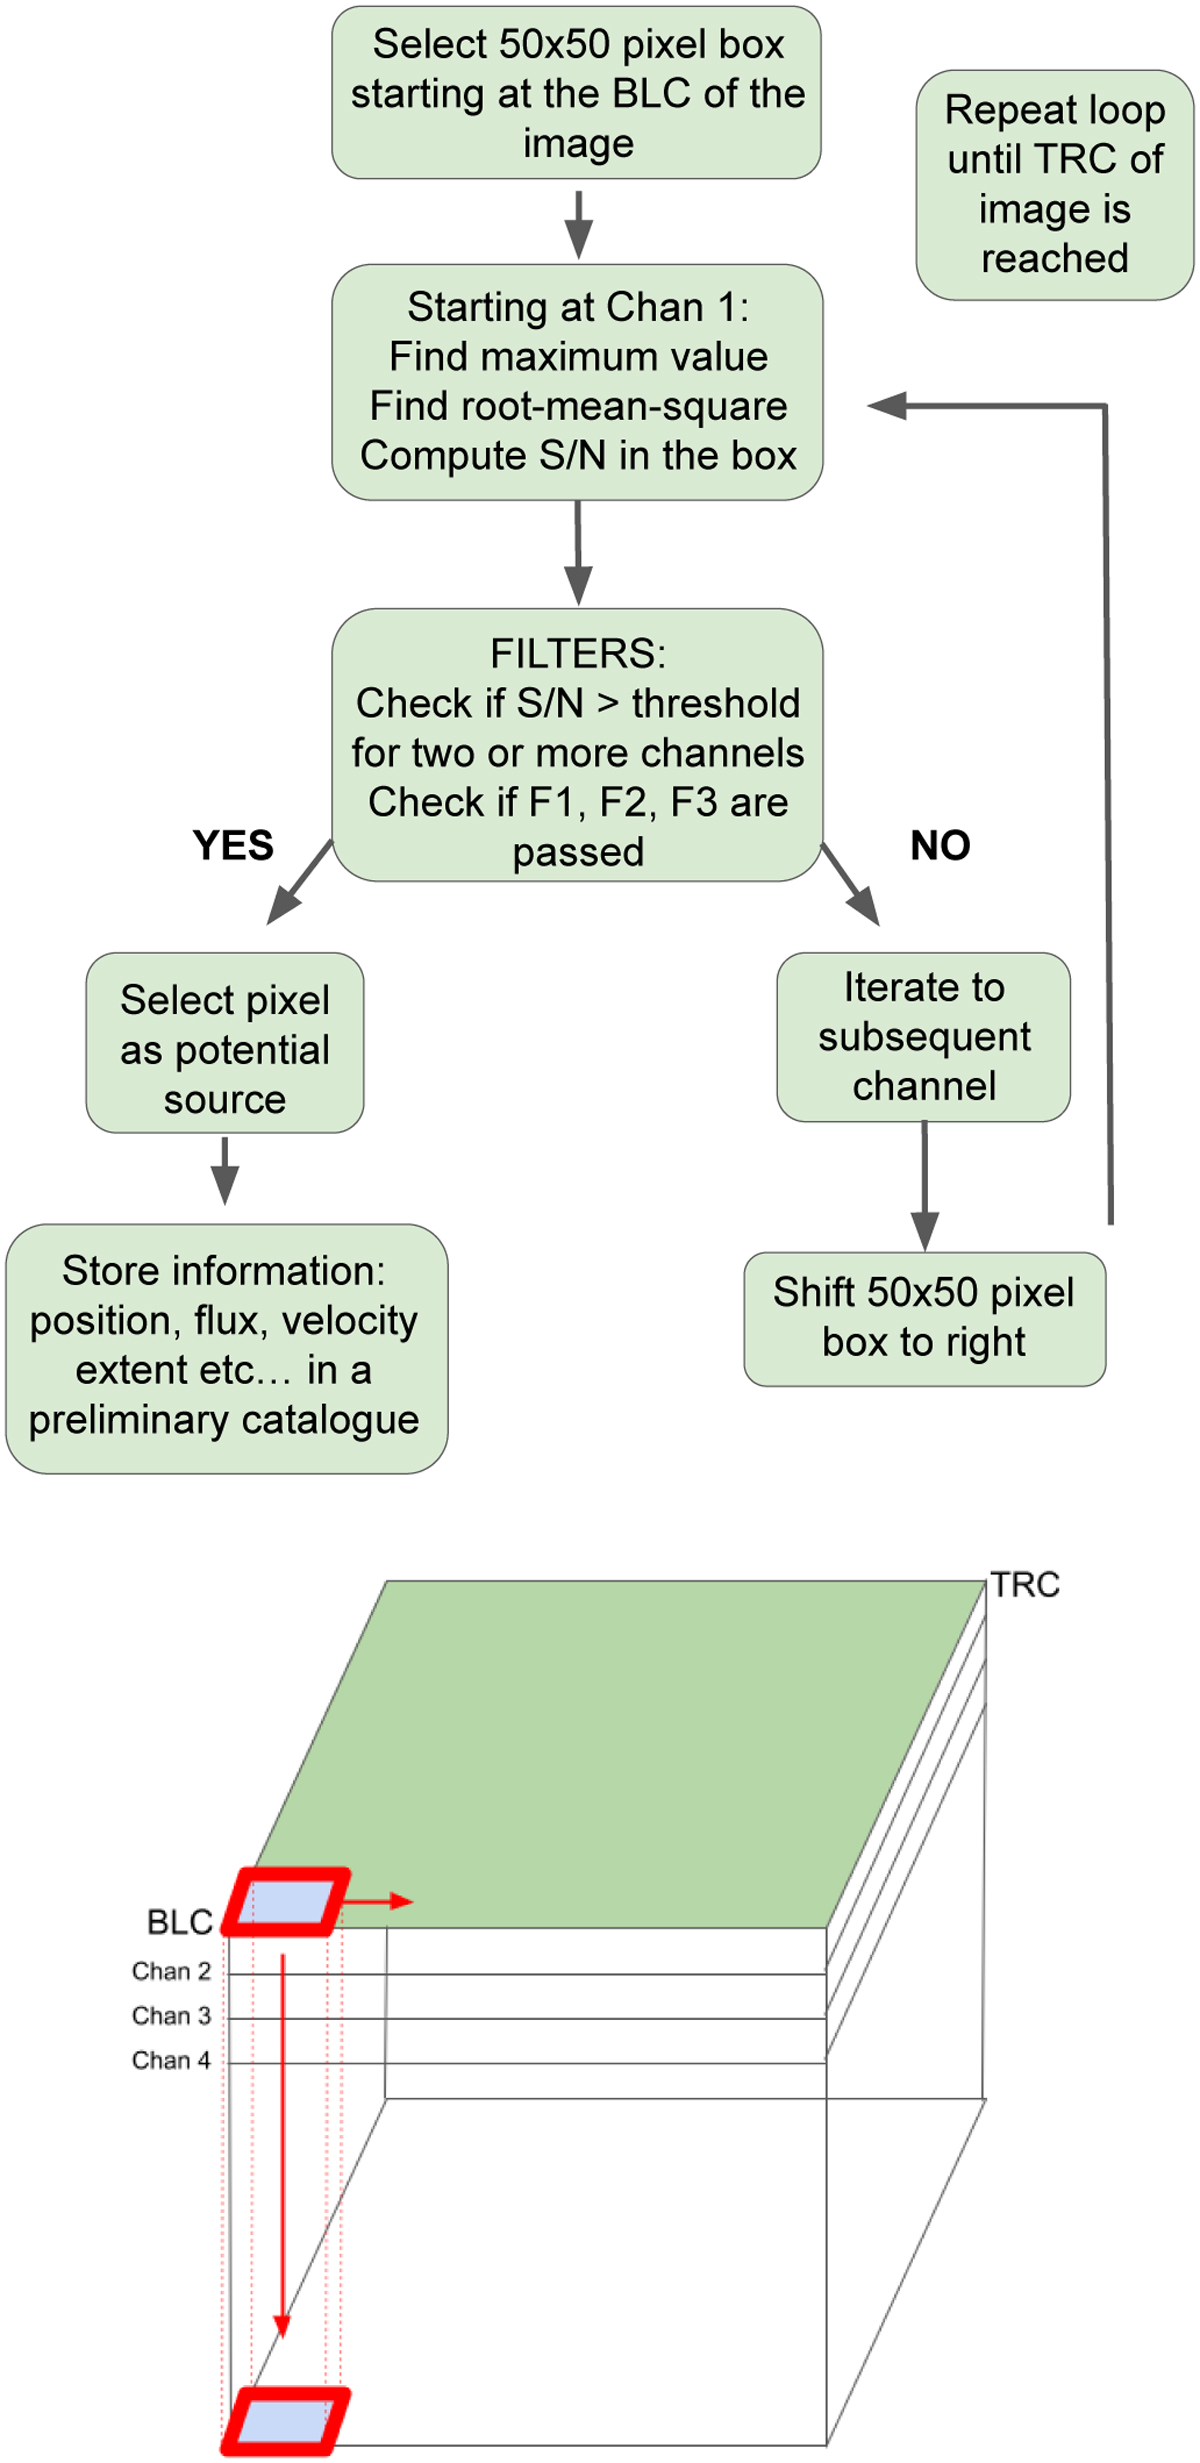
Algorithm flow chart for the Source Extraction Code (SEC) which details the selection of the positions and channels of maser candidates based on the signal-to-noise ratio S/N (top panel; for details, see Sect. 3). Illustration of the process used by the SEC (bottom panel). A 50 × 50 pixel box that starts from the bottom left corner (BLC) iterates first through channels to detect sources until it reaches the top right corner (TRC).
Current usage metrics show cumulative count of Article Views (full-text article views including HTML views, PDF and ePub downloads, according to the available data) and Abstracts Views on Vision4Press platform.
Data correspond to usage on the plateform after 2015. The current usage metrics is available 48-96 hours after online publication and is updated daily on week days.
Initial download of the metrics may take a while.