Fig. 18
Download original image
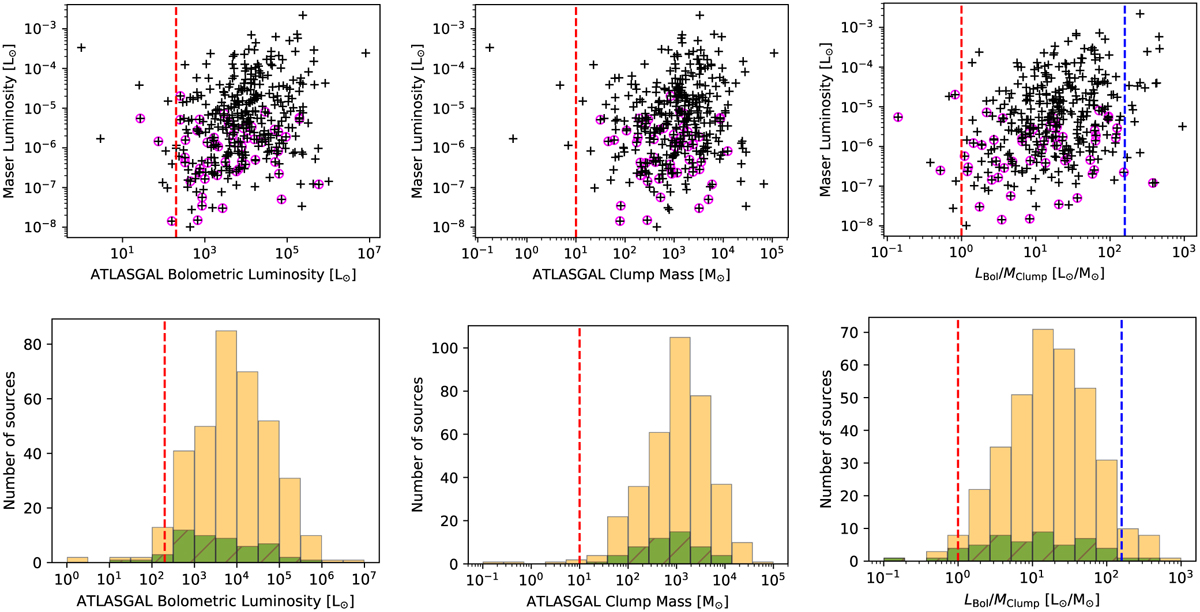
Maser-integrated luminosity measured in D-conflguration GLOSTAR data as a function of ATLASGAL clump properties shown in the top row: Bolometric luminosity (left), FWHM mass (middle), and luminosity-to-mass ratio (right). The black crosses represent masers with ATLASGAL compact source catalogue (CSC) counterparts, while the crosses surrounded by magenta circles highlight masers that were newly detected as part of the GLOSTAR survey. The bottom row shows the distribution of ATLASGAL molecular clump properties for the new masers (hatched green) in comparison to the full sample (yellow) of clumps associated with masers. The red-dashed lines denote the lower limits of the respective properties determined by Ortiz-León et al. (2021). The blue-dashed line denotes the upper bound at which maser emission is expected to decline due to the disruption of the physical conditions required for maser emission (e.g. expanding НΠ regions and dispersion of the host clump; Walsh et al. 1997, 1998; van der Walt et al. 2003).
Current usage metrics show cumulative count of Article Views (full-text article views including HTML views, PDF and ePub downloads, according to the available data) and Abstracts Views on Vision4Press platform.
Data correspond to usage on the plateform after 2015. The current usage metrics is available 48-96 hours after online publication and is updated daily on week days.
Initial download of the metrics may take a while.