Fig. 16
Download original image
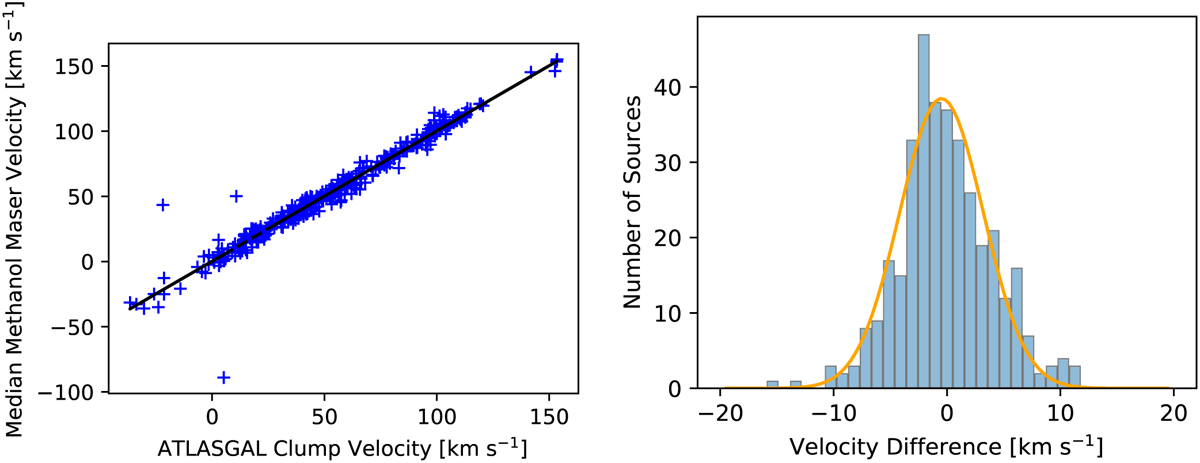
Comparison of the velocities of the methanol masers and their associated dust clumps. Left: the median methanol maser velocity plotted as a function of the ATLASGAL clump velocity for sources with an association to an ATLASGAL compact source catalogue (CSC) source. The black line is the fitted linear result, with a Spearman’s rank coefficient of r = 0.98 and p-value << 0.0013. Right: distribution of the offsets between the median methanol maser velocities and the molecular line velocities from ATLASGAL. Fitting the distribution with a Gaussian yields a mean of 0.49 ± 0.18 km s−1 and standard deviation of 3.69 ±0.1 km s−1. We use 3σ (11 km s−1) as a confidence threshold to identify outliers.
Current usage metrics show cumulative count of Article Views (full-text article views including HTML views, PDF and ePub downloads, according to the available data) and Abstracts Views on Vision4Press platform.
Data correspond to usage on the plateform after 2015. The current usage metrics is available 48-96 hours after online publication and is updated daily on week days.
Initial download of the metrics may take a while.