Fig. 15
Download original image
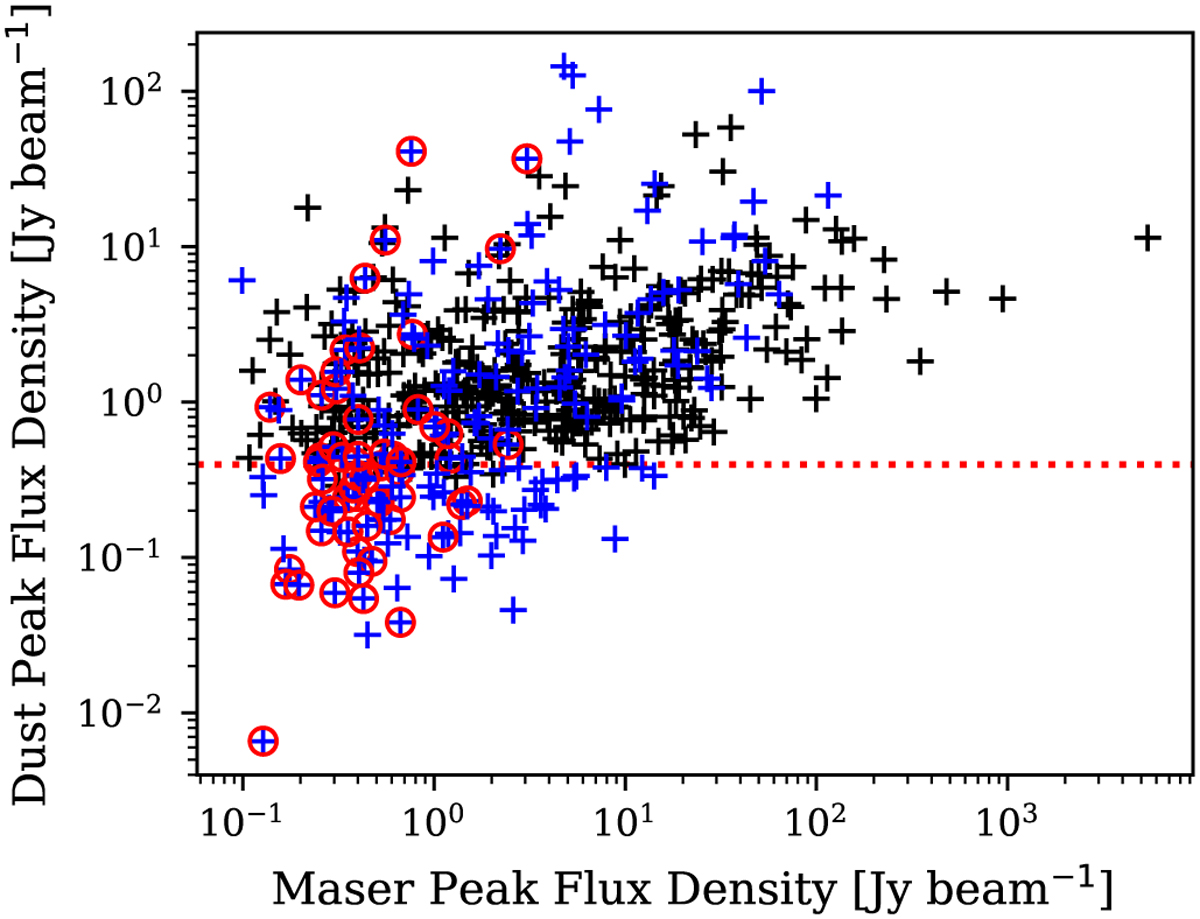
CH3OH 6.7 GHz maser peak flux density compared to 870 µm dust emission extracted from ATLASGAL maps towards the maser position. Black crosses correspond to sources that were matched to the ATLASGAL compact source catalogue (CSC). The remaining sources are marked in blue. The red dashed line corresponds to the ATLASGAL 6σ noise level and the red circles highlight the new masers found in this work.
Current usage metrics show cumulative count of Article Views (full-text article views including HTML views, PDF and ePub downloads, according to the available data) and Abstracts Views on Vision4Press platform.
Data correspond to usage on the plateform after 2015. The current usage metrics is available 48-96 hours after online publication and is updated daily on week days.
Initial download of the metrics may take a while.