Fig. 12
Download original image
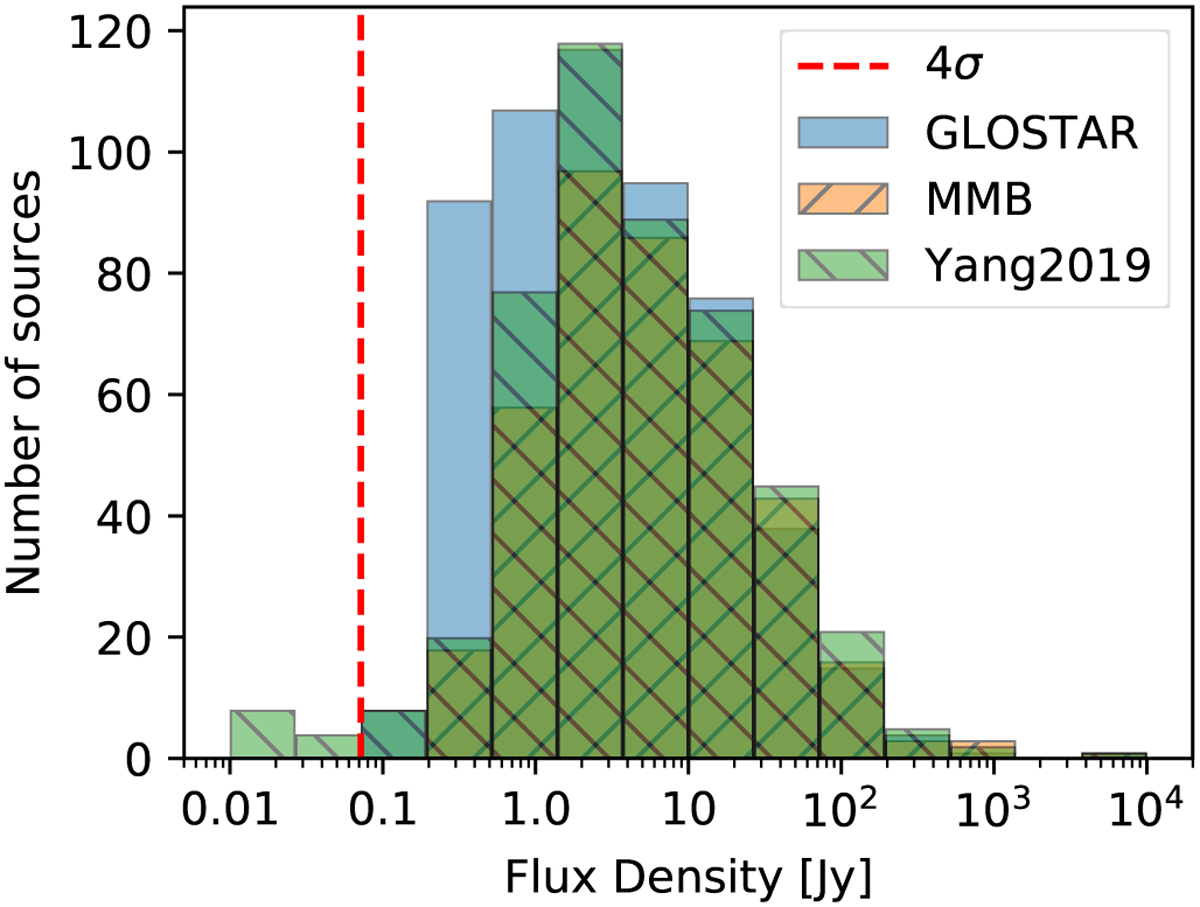
Flux distribution of masers as reported in the GLOSTAR, the MMB (Green et al. 2009) and the Yang et al. (2019b) catalogues. The vertical dashed red line corresponds to the average 4σ noise level for the GLOSTAR methanol D-configuration data (~70 mJy beam−1). The sources of the other surveys that were not detected in the GLOSTAR survey are well below the sensitivity level of our unbiased search.
Current usage metrics show cumulative count of Article Views (full-text article views including HTML views, PDF and ePub downloads, according to the available data) and Abstracts Views on Vision4Press platform.
Data correspond to usage on the plateform after 2015. The current usage metrics is available 48-96 hours after online publication and is updated daily on week days.
Initial download of the metrics may take a while.