Open Access
Fig. 1
Download original image
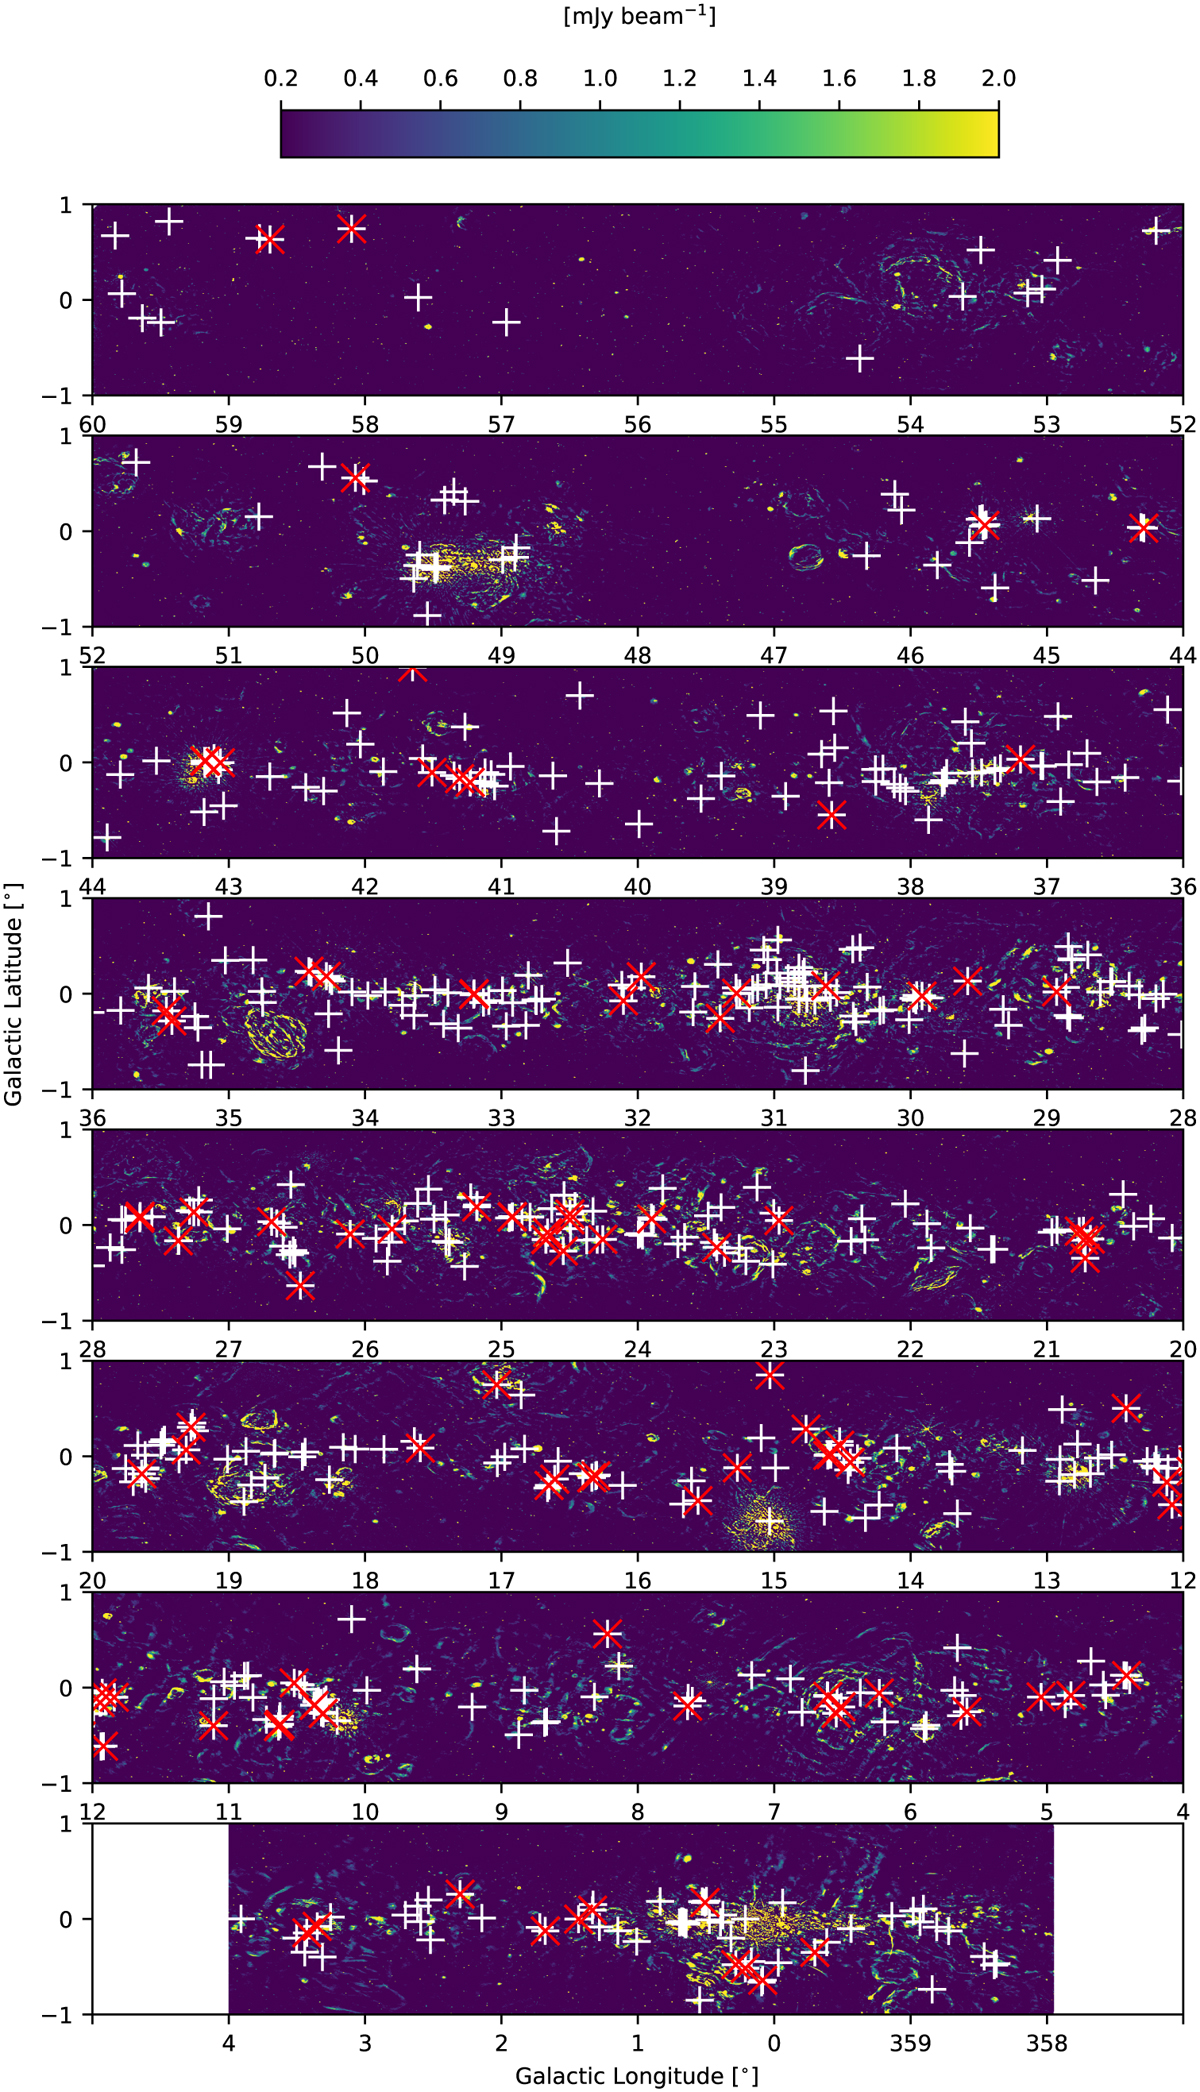
Methanol maser detections plotted as white crosses on top of the D-configuration continuum images from GLOSTAR where the flux has been limited to be between 0.2 and 2 mJy beam−1 for visibility. The red “x”s show the positions of all new methanol masers as discussed in Sect. 4.5.
Current usage metrics show cumulative count of Article Views (full-text article views including HTML views, PDF and ePub downloads, according to the available data) and Abstracts Views on Vision4Press platform.
Data correspond to usage on the plateform after 2015. The current usage metrics is available 48-96 hours after online publication and is updated daily on week days.
Initial download of the metrics may take a while.