Fig. 6
Download original image
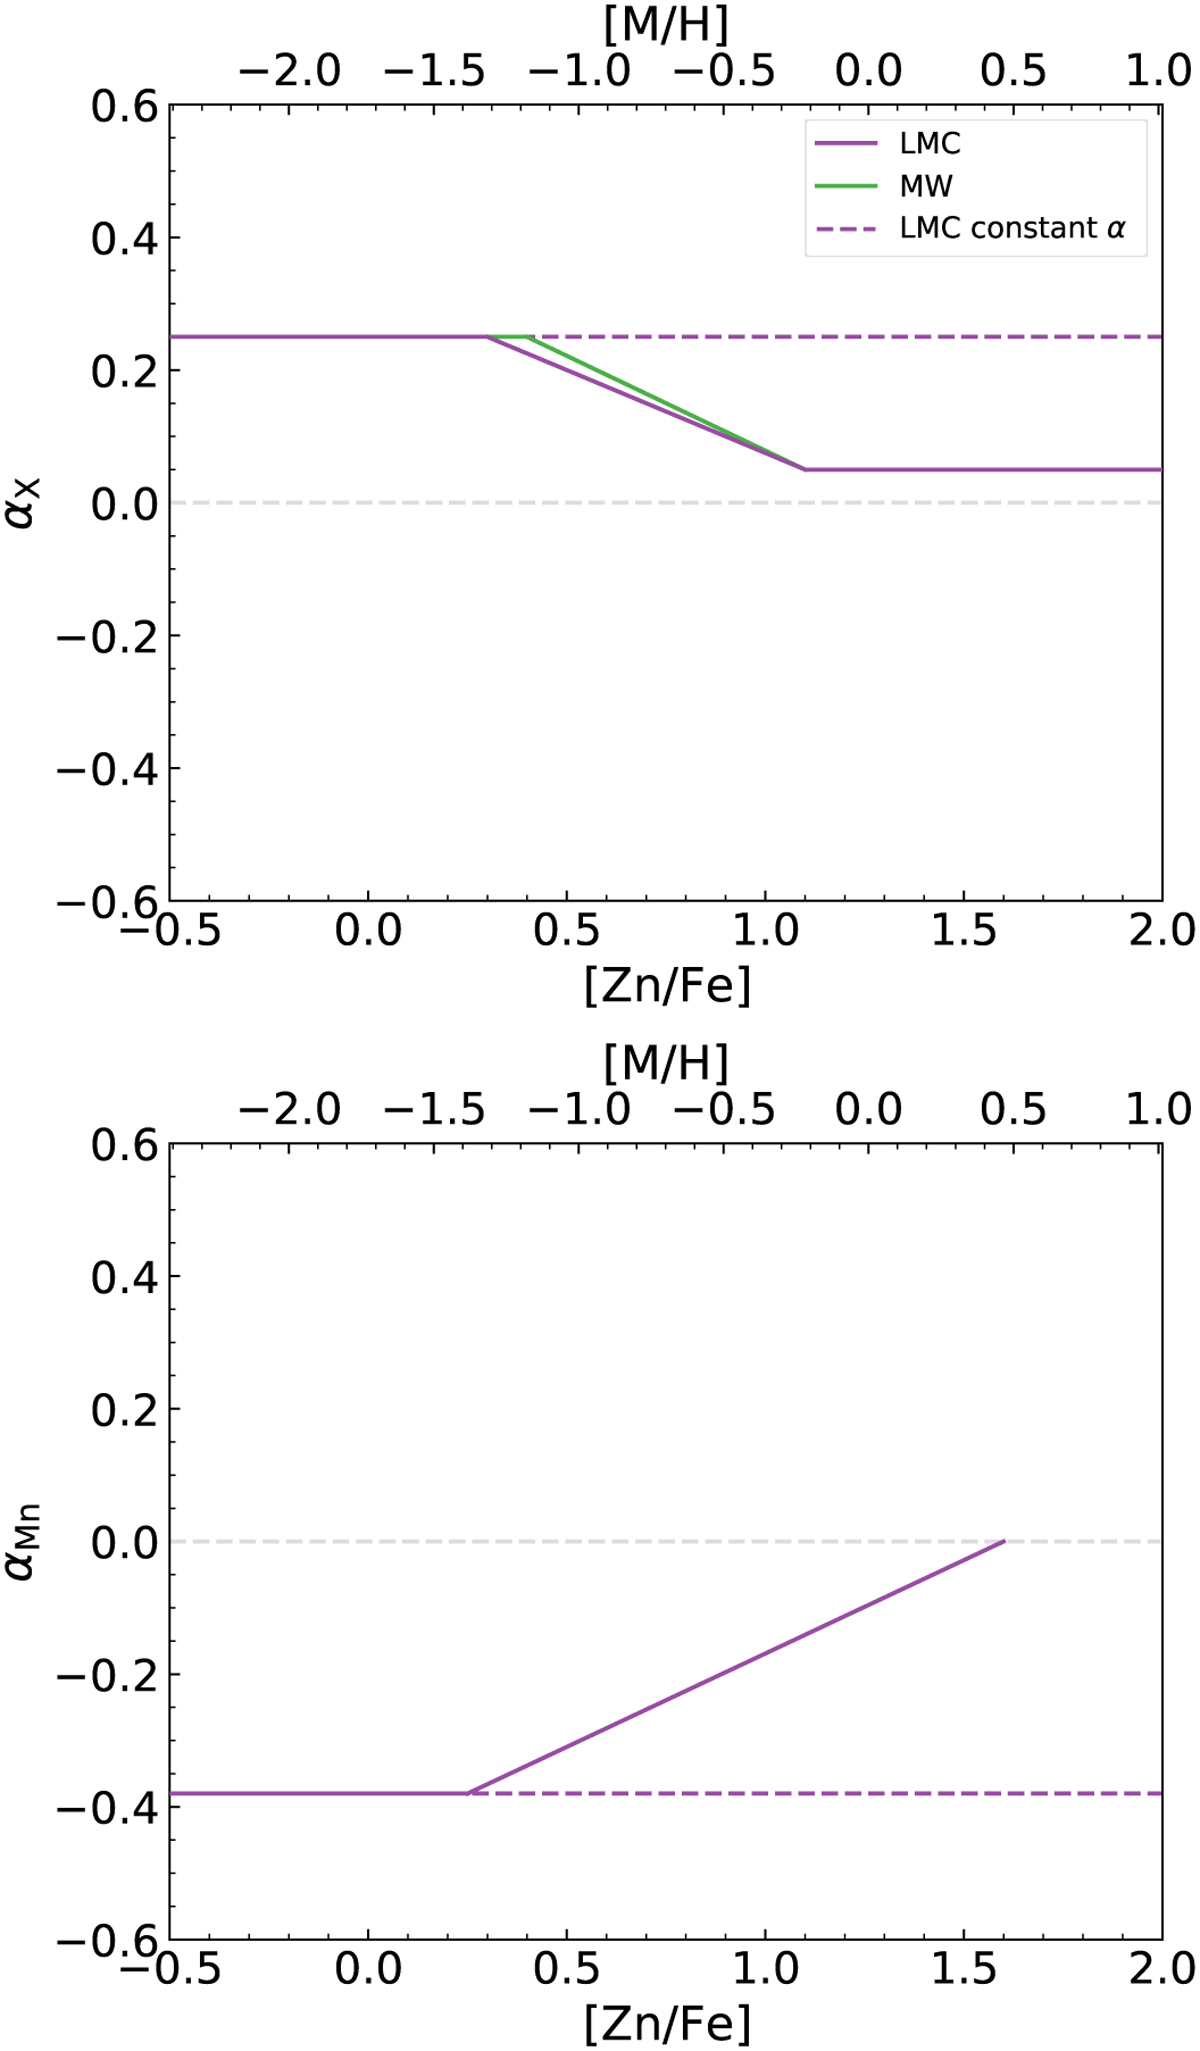
Assumed nucleosynthetic over- or underabundances αX for the α-elements X (S, Si, Mg, and Ti) and Mn with respect to [Zn/Fe] and metallicity [M/H], The solid green curve shows the Milky Way, the solid purple curve shows the LMC as adopted from de Boer et al. (2014), and the dashed purple curve shows the LMC with a constant over- or underabundance plateau. For the plateau of the α -elements, we used as reference αs = 0.25.
Current usage metrics show cumulative count of Article Views (full-text article views including HTML views, PDF and ePub downloads, according to the available data) and Abstracts Views on Vision4Press platform.
Data correspond to usage on the plateform after 2015. The current usage metrics is available 48-96 hours after online publication and is updated daily on week days.
Initial download of the metrics may take a while.