Fig. 2
Download original image
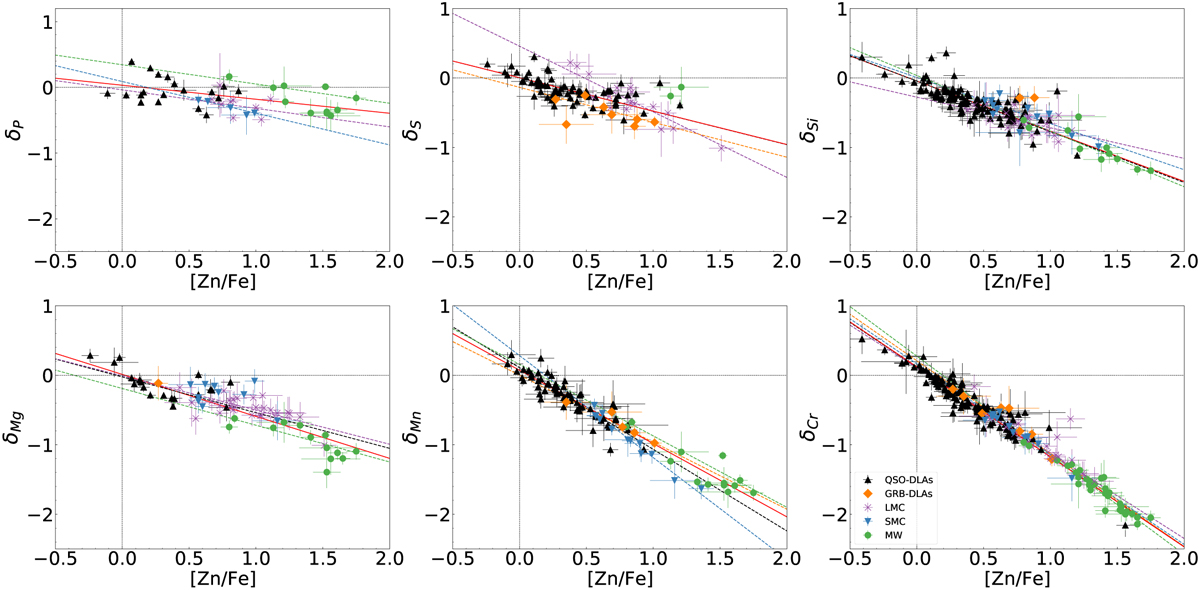
Dust depletion of element X (δX) against [Zn/Fe], The black triangles show QSO-DLAs, the green dots show the Milky Way, the purple stars show the LMC, the blue triangles show the SMC, and the orange diamonds show the GRB-DLAs. The red line shows the linear fit to the data. The slope becomes steeper for elements that are more strongly depleted into dust grains.
Current usage metrics show cumulative count of Article Views (full-text article views including HTML views, PDF and ePub downloads, according to the available data) and Abstracts Views on Vision4Press platform.
Data correspond to usage on the plateform after 2015. The current usage metrics is available 48-96 hours after online publication and is updated daily on week days.
Initial download of the metrics may take a while.