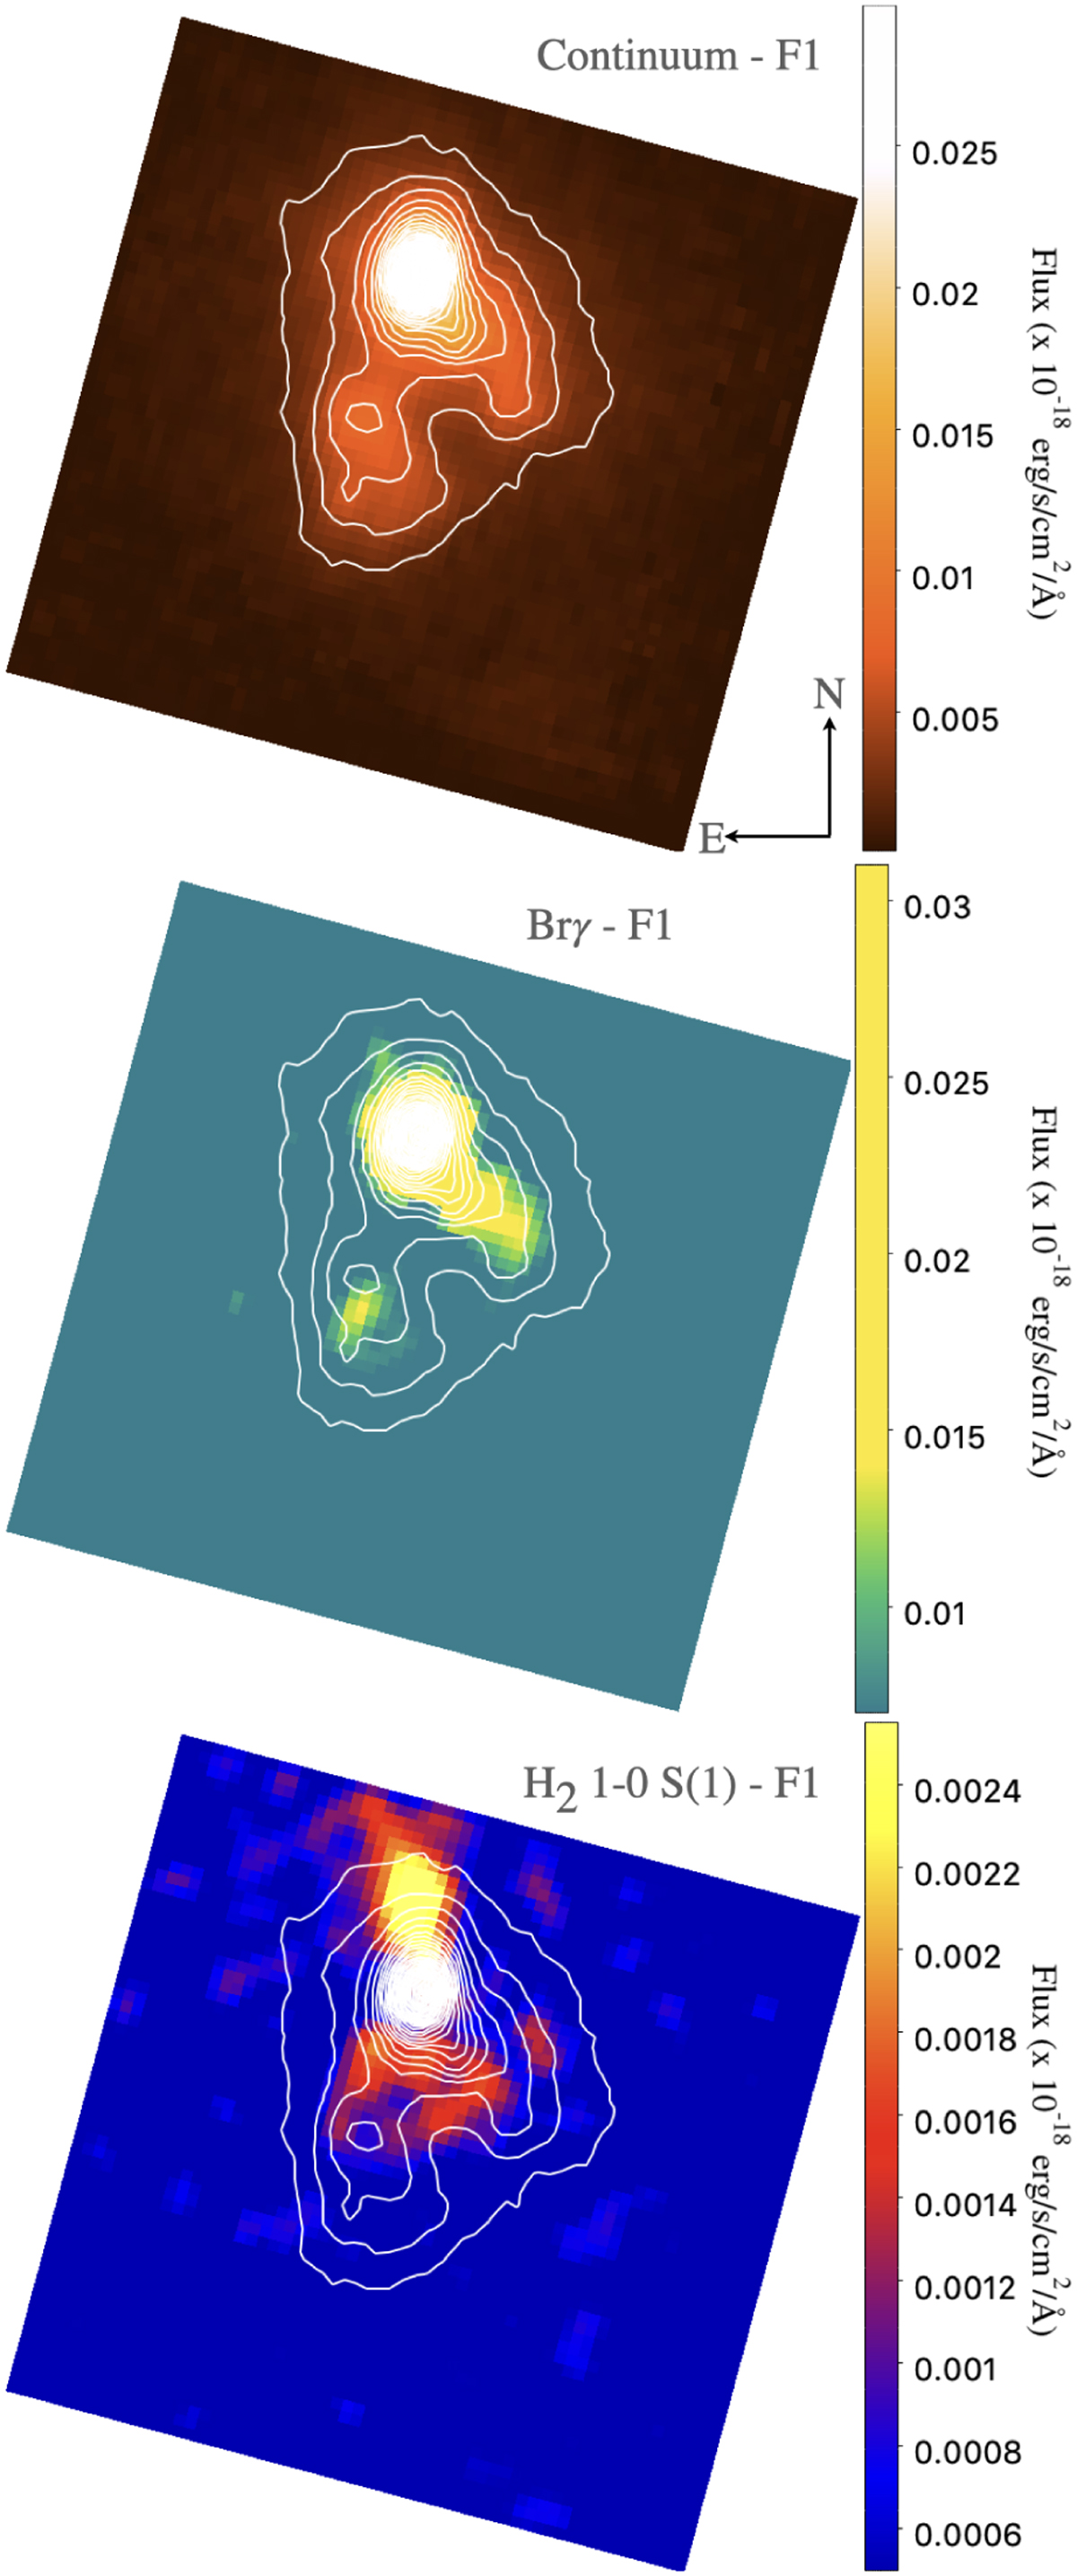
Fig. 6
Download original image
Maps obtained toward Field 1. The 2.2 μm continuum map (top) is displayed in color scale with contours that are superimposed for comparison in the Brγ (middle) and H2 1–0 S(1) (bottom) line emission maps (continuum subtracted). The background rms is ~0.15, 2.97, and 0.65 × 10⁻²³ erg s−1 cm−2Å−1 for the continuum, the Brγ, and the H2 maps respectively.
Current usage metrics show cumulative count of Article Views (full-text article views including HTML views, PDF and ePub downloads, according to the available data) and Abstracts Views on Vision4Press platform.
Data correspond to usage on the plateform after 2015. The current usage metrics is available 48-96 hours after online publication and is updated daily on week days.
Initial download of the metrics may take a while.