Fig. 17
Download original image
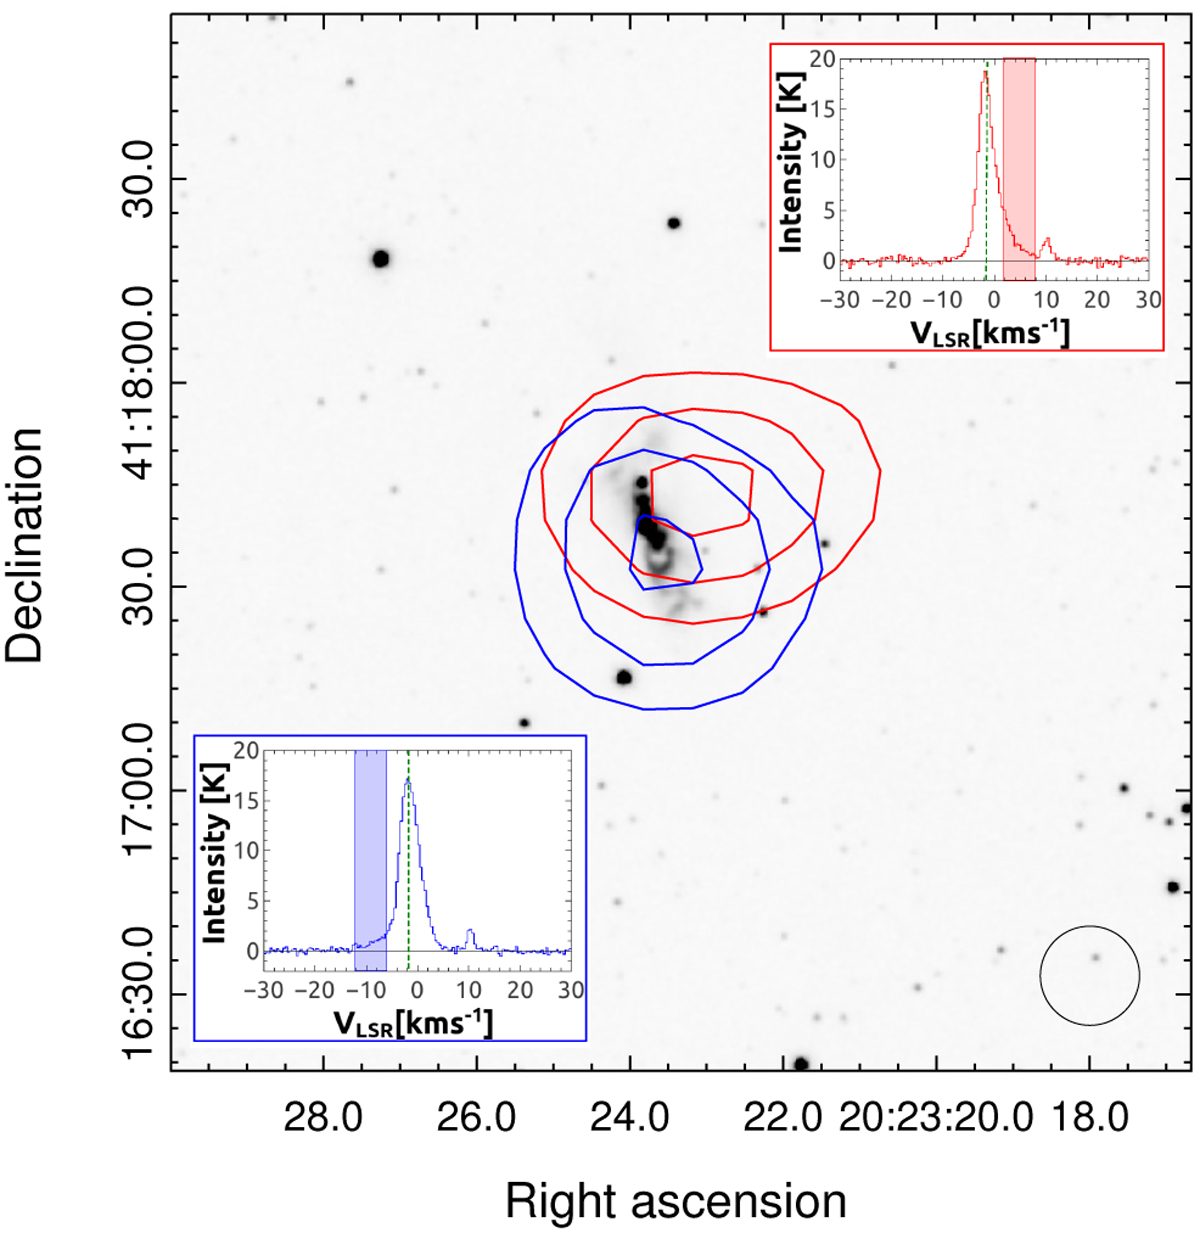
UKIDSS image at Ks band of MYSO G79. The blue and red contours represent the JCMT 12CO J = 3–2 emission averaged from −6 to −12 km s−1 (blue lobe), and from 2 to 8 km s−1 (red lobe), respectively. The blue contours are at 1, 2, and 3 K and the red contours are at 2, 3, and 4 K. The σ noise level is 0.3 K. The averaged spectra (in a beam area) toward the center of the two features are shown. The vertical dashed green lines represent the systemic velocity of the source (at about −1.7 km s−1). The circle of 14.″5 in diameter at the bottom right corner represents the JCMT beam.
Current usage metrics show cumulative count of Article Views (full-text article views including HTML views, PDF and ePub downloads, according to the available data) and Abstracts Views on Vision4Press platform.
Data correspond to usage on the plateform after 2015. The current usage metrics is available 48-96 hours after online publication and is updated daily on week days.
Initial download of the metrics may take a while.