Fig. 15
Download original image
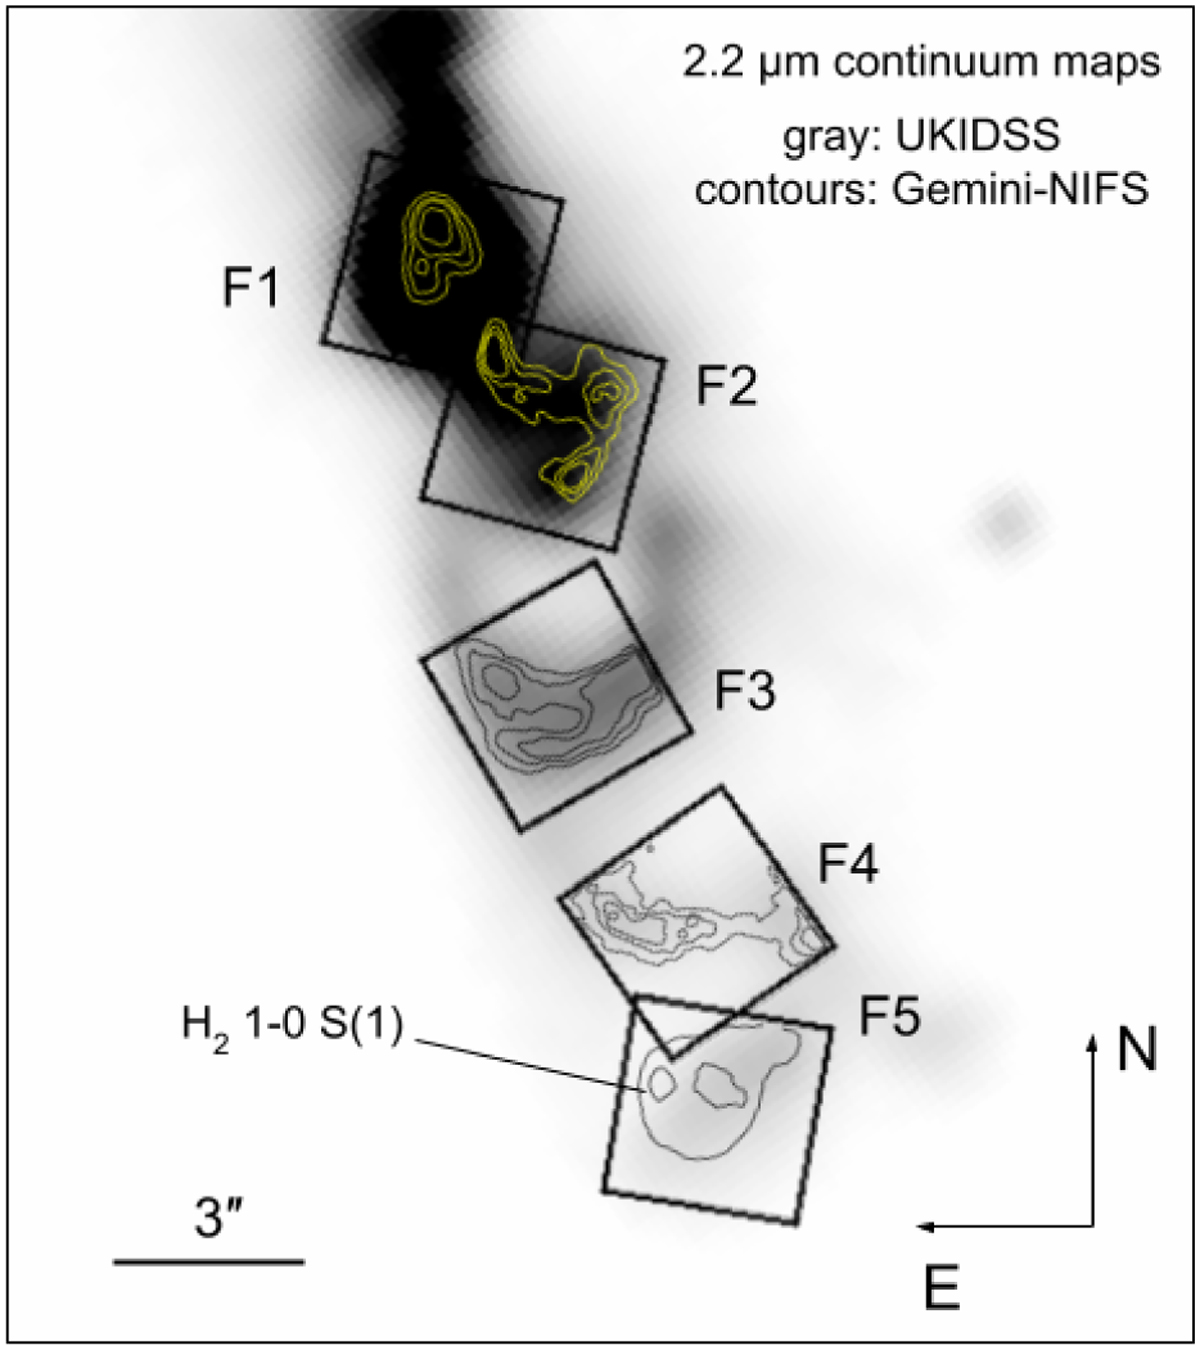
Ks-band emission (in gray) obtained from UKIDSS. The contours in each field are the continuum at 2.2 μm obtained from the NIFS data, except in Field5 where some contours of the H2 S(1) 1–0 emission are displayed. For a better display, the emissions observed with NIFS were slightly smoothed with a boxcar function with a factor of 2.
Current usage metrics show cumulative count of Article Views (full-text article views including HTML views, PDF and ePub downloads, according to the available data) and Abstracts Views on Vision4Press platform.
Data correspond to usage on the plateform after 2015. The current usage metrics is available 48-96 hours after online publication and is updated daily on week days.
Initial download of the metrics may take a while.