Fig. 3
Download original image
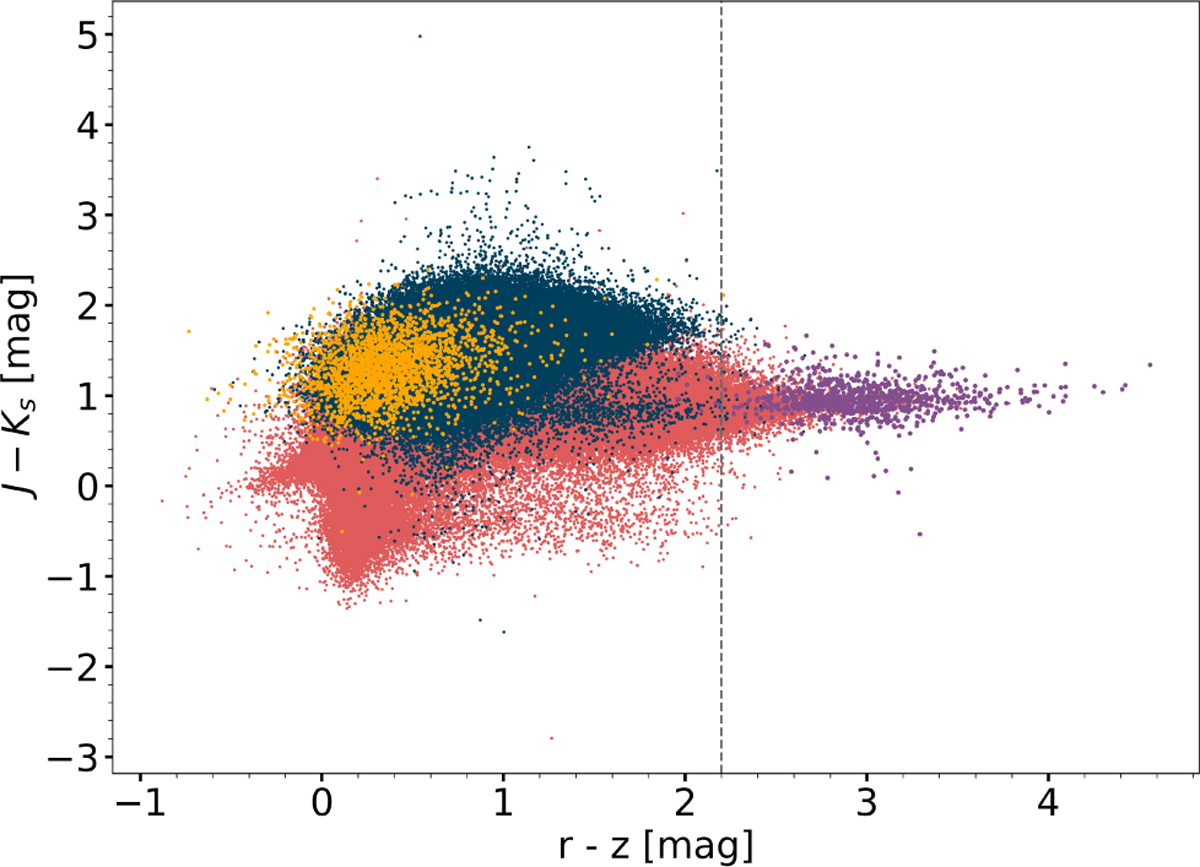
Colour-colour diagram built using true extended (dark blue) and true point (red) sources. Yellow dots represent the sample of 10481 QSOs. Purple dots represent the shortlisted candidate UCDs obtained by parallax-guided and proper motion-guided methods. The vertical grey line marks the r − z > 2.2 mag limit for a source to be shortlisted as candidate UCD.
Current usage metrics show cumulative count of Article Views (full-text article views including HTML views, PDF and ePub downloads, according to the available data) and Abstracts Views on Vision4Press platform.
Data correspond to usage on the plateform after 2015. The current usage metrics is available 48-96 hours after online publication and is updated daily on week days.
Initial download of the metrics may take a while.