Fig. 2
Download original image
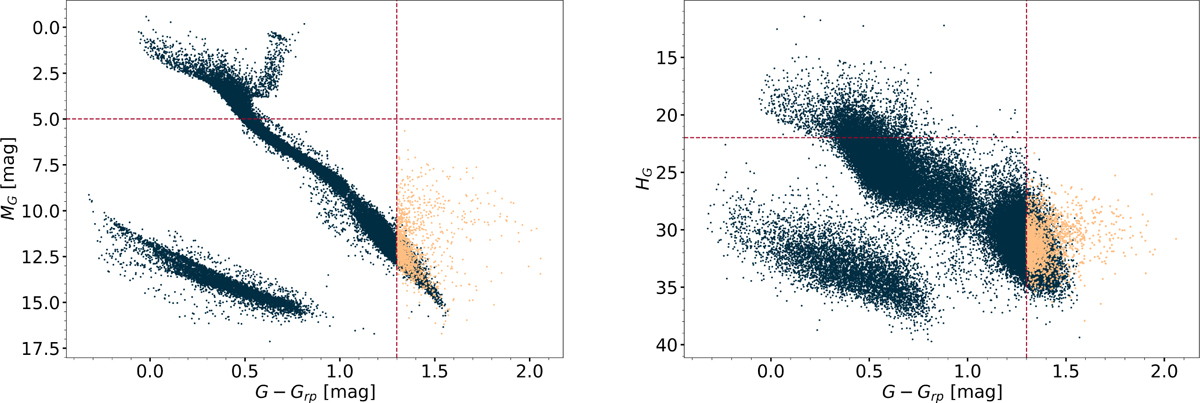
Location of the objects shortlisted as candidate UCDs via astrometric selection, for an example 20 × 20 deg2 region, in a colour-magnitude (left) and a reduced proper motion (right) diagram built using Gaia EDR3 sources with parallaxes larger than 10 mas (dark blue dots). The vertical and horizontal red lines mark the boundaries for a source to be shortlisted as candidate UCD. Sources fulfilling these conditions are overplotted in yellow.
Current usage metrics show cumulative count of Article Views (full-text article views including HTML views, PDF and ePub downloads, according to the available data) and Abstracts Views on Vision4Press platform.
Data correspond to usage on the plateform after 2015. The current usage metrics is available 48-96 hours after online publication and is updated daily on week days.
Initial download of the metrics may take a while.