Fig. 19
Download original image
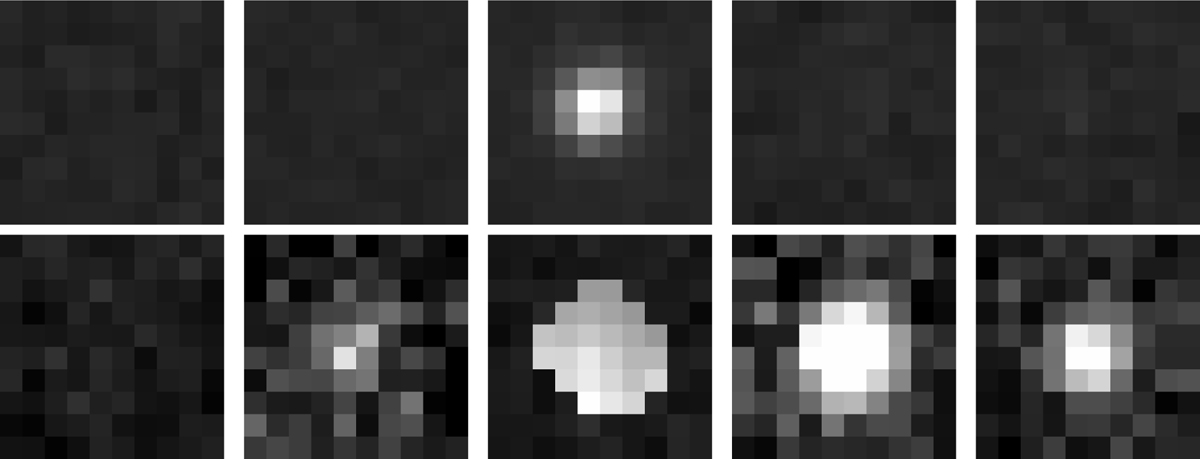
Images from the J-PLUS DR2 archive with the photometry in different filters for two of the strong line emitters detected. The first row corresponds to an excess in the Ca ii H and K (filter J0395) emission lines (first object in Table 3), with images in the filters u, J0378, J0395, J0410, and J0430 (from left to right). The second row shows an excess in the Hα (filter J0660) emission line (seventh object in Table 3), with images in the filters J0515, r, J0660, i, and J0861 (from left to right). For both objects, all images shown were taken within a time interval of about 40 min.
Current usage metrics show cumulative count of Article Views (full-text article views including HTML views, PDF and ePub downloads, according to the available data) and Abstracts Views on Vision4Press platform.
Data correspond to usage on the plateform after 2015. The current usage metrics is available 48-96 hours after online publication and is updated daily on week days.
Initial download of the metrics may take a while.