Fig. 18
Download original image
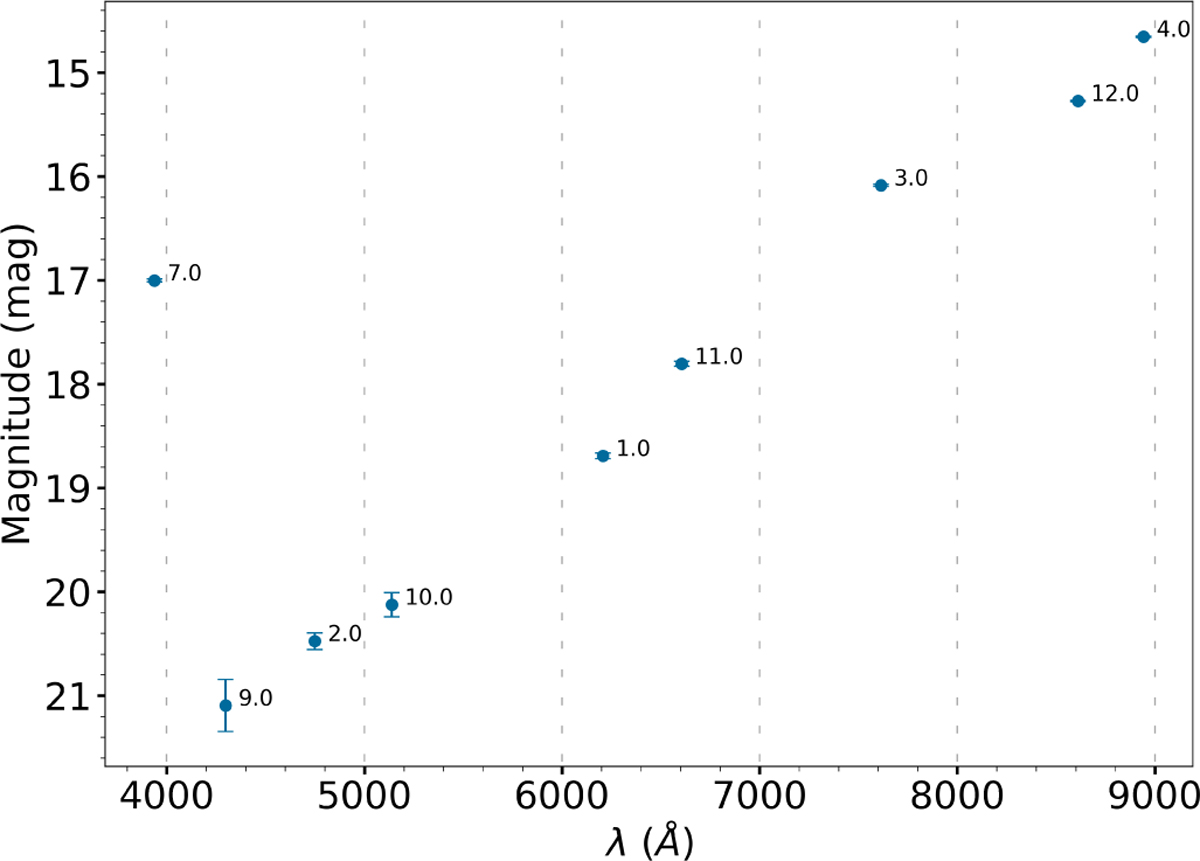
Example of a detected strong excess in the filter 7.0 (J0395), which corresponds to Ca ii H and K emission lines. The figure shows the J-PLUS photometry of the first object in Table 3, with error bars representing the error in the magnitude. The algorithm detects that the magnitude in the filter J0395 is 0.8 times the magnitude in the filter 9.0 (J0430), and recognises this as a possible emission line. In this case, the threshold value for the excess detection was 0.96.
Current usage metrics show cumulative count of Article Views (full-text article views including HTML views, PDF and ePub downloads, according to the available data) and Abstracts Views on Vision4Press platform.
Data correspond to usage on the plateform after 2015. The current usage metrics is available 48-96 hours after online publication and is updated daily on week days.
Initial download of the metrics may take a while.