Fig. 15
Download original image
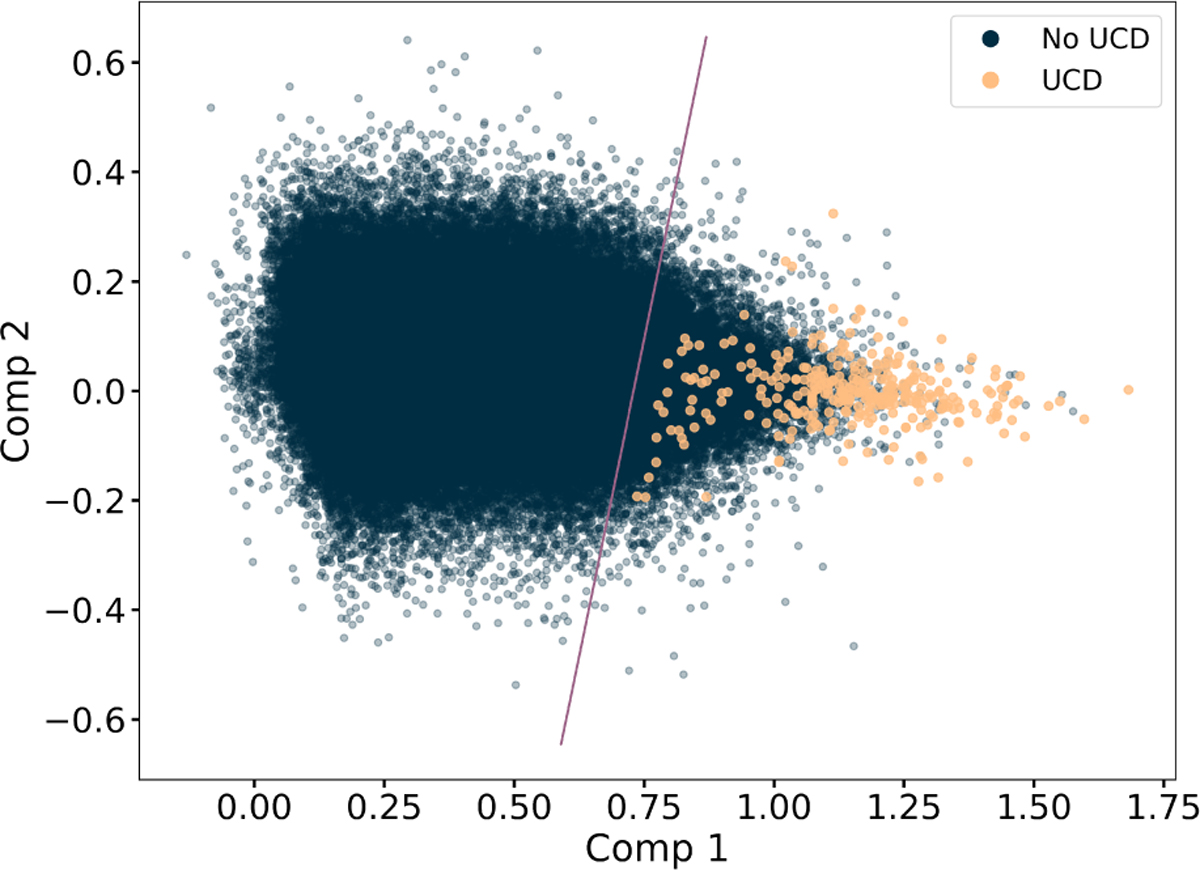
Projection of the sample used in the ML methodology onto the hyperplane defined by the first two principal components, with an explained variance ratio of 93%. Points are colour-coded according to their class, UCD (yellow) or non-UCD (dark blue). The purple line represents the decision threshold used to make a first cut at identifying UCDs, keeping only the objects that fall on the UCD side.
Current usage metrics show cumulative count of Article Views (full-text article views including HTML views, PDF and ePub downloads, according to the available data) and Abstracts Views on Vision4Press platform.
Data correspond to usage on the plateform after 2015. The current usage metrics is available 48-96 hours after online publication and is updated daily on week days.
Initial download of the metrics may take a while.