Fig. 12
Download original image
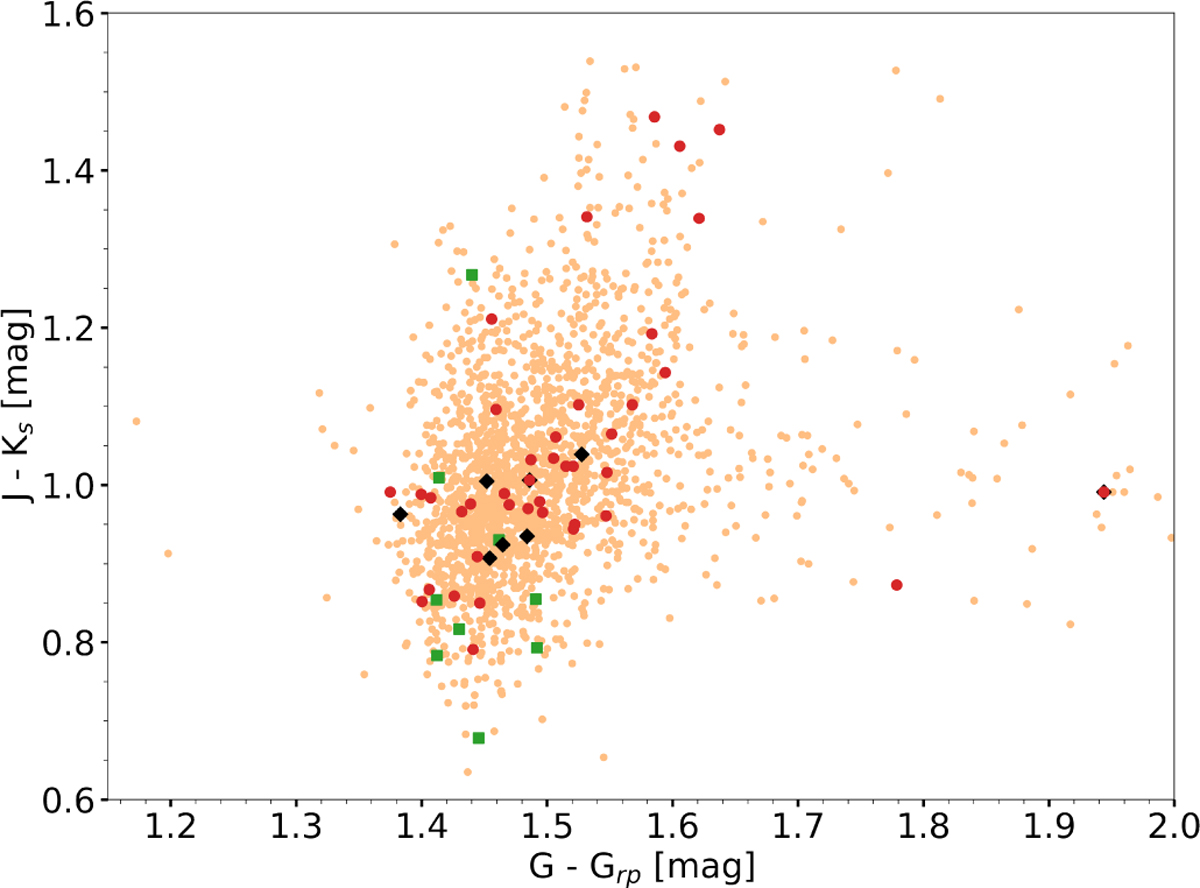
J − Ks (2MASS) vs. G − GRP (Gaia) diagram of our candidate UCDs with good 2MASS photometric quality (Qflg=A) in J and Ks bands. Black diamonds represent our eight new nearby candidate UCDs at distances d < 40 pc. Green squares stand for new candidate UCDs with tangential velocities vtan > 100 km s−1. Red circles represent candidate UCDs with a possible membership in a nearby young association.
Current usage metrics show cumulative count of Article Views (full-text article views including HTML views, PDF and ePub downloads, according to the available data) and Abstracts Views on Vision4Press platform.
Data correspond to usage on the plateform after 2015. The current usage metrics is available 48-96 hours after online publication and is updated daily on week days.
Initial download of the metrics may take a while.