Open Access
Fig. 1
Download original image
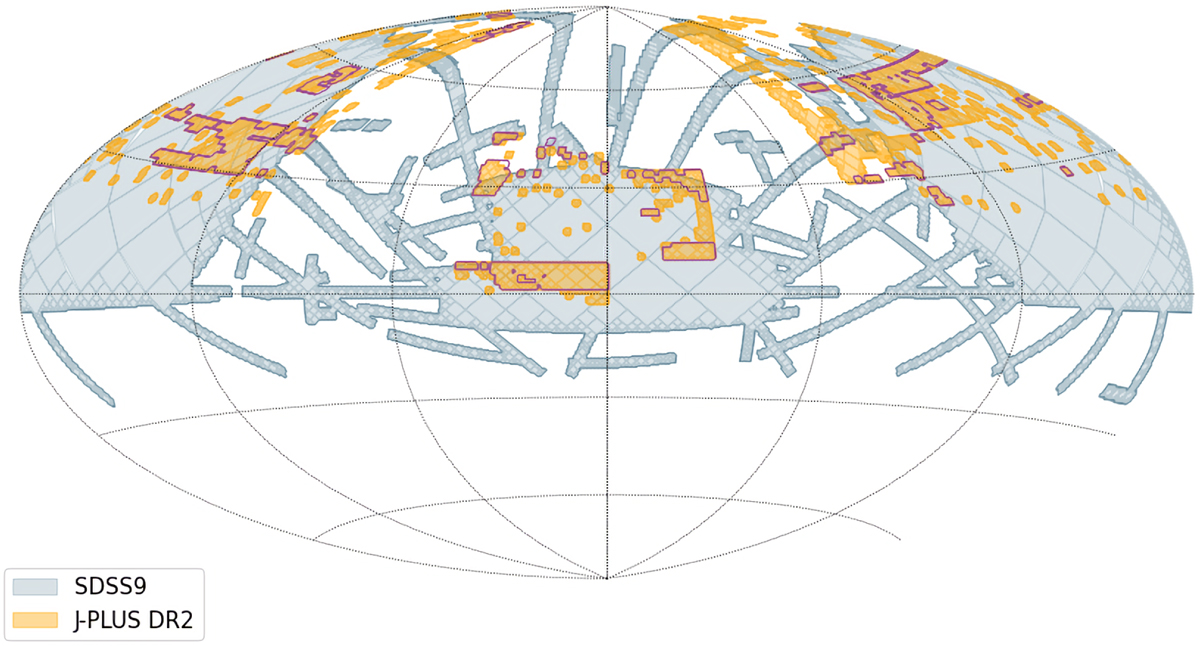
Sky coverage of J-PLUS DR2 (yellow) in α, δ coordinates (centred on α = 0 deg, δ = 0 deg, with α rising to the left). The SDSS DR9 footprint is superimposed in blue. The purple line represents the border of the J-PLUS DR1 coverage map.
Current usage metrics show cumulative count of Article Views (full-text article views including HTML views, PDF and ePub downloads, according to the available data) and Abstracts Views on Vision4Press platform.
Data correspond to usage on the plateform after 2015. The current usage metrics is available 48-96 hours after online publication and is updated daily on week days.
Initial download of the metrics may take a while.